
Speaker
Description
Efficiency of Power Conversion and Power Loss Estimation of Totem-Pole PFC Converter Based on IR Thermography
M. Strąkowska, P. Górecki *, R. Kasikowski *
* Łódź University of Technology, Institute of Electronics, 211/215 Wólczańska Str, 90-924 Łódź, Poland, rafal.kasikowski@p.lodz.pl
** Gdynia Maritime University, Faculty of Electrical Engineering, 81-87 Morska Str, 81-225 Gdynia, Poland, p.gorecki@we.umg.edu.pl
Abstract
This paper presents a practical methodology for estimating power loss of Totem-Pole PFC Converter based on infrared thermography. The proposed approach enables contactless, real-time assessment of thermal behavior during normal system operation, without requiring circuit modifications or interruption of service. Unlike conventional methods that rely on datasheet parameters or pre-production characterization, IR thermography captures the actual thermal signature of the assembled PCB under realistic operating conditions, load profiles, and environmental factors. The main aim of this work is to validate and correlate thermal measurements with electrical power dissipation, creating empirical relationships between surface temperature distributions and actual power losses that account for PCB geometry, ambient conditions, and component packaging.
1. Introduction
Components with the high heat production such as power MOSFETs, GaN transistors, inductors, power resistors or high-current traces require special attention when evaluating power dissipation [1, 2]. These elements typically operate near their thermal limits and are most susceptible to thermally-accelerated aging. Traditional power loss estimation methods rely on datasheet parameters and circuit simulation, which may not accurately reflect real-world operating conditions or account for manufacturing variations and aging effects.
Infrared thermography presents a powerful non-invasive diagnostic tool for power loss estimation in operational PCB assemblies. By capturing the thermal signature of individual components and circuit regions, IR imaging enables direct measurement of surface temperature distributions under realistic operating conditions. When combined with thermal modeling and heat transfer analysis, these temperature measurements can be inversely correlated to power dissipation levels, providing empirical validation of theoretical calculations and revealing discrepancies caused by aging, manufacturing tolerances, or suboptimal thermal design.
2.Thermal model of the printed Circuit Board
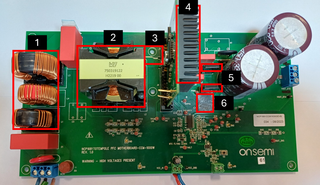
Evaluation Board NCP1681CCM1KWGEVB is modeled using a nodal thermal network. The board is divided into several thermal nodes: six represent heat sources, and two represent the PCB surfaces. Figure 1a presents the evaluation board with marked heat sources and Figure 1b the daughter board with GaN transistors.
a)
b)
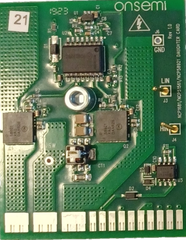
Figure.1 Totem pole evaluation board with marked heat sources (a) and daughter board with GaN transistors (b)
a)
b)
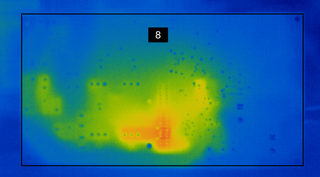
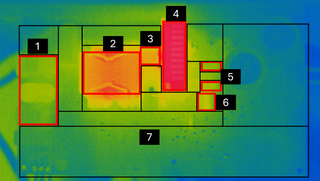
Figure 2. Infrared image of PCB board - top view (a), bottom view (b) with marked regions (black rectangles - PCB surface, white rectangles - heat sources)
The measurements were performed using an OPTRIS PI450 non-cooled IR camera to estimate heat losses and power efficiency in the circuit based on the PCB topology and IR thermography. The input voltage was 230 V, and the power efficiency was estimated for two output power levels: 100 W and 200 W. Heat loss from each node to the surrounding environment occurs through both convection and radiation. For each surface node, convection and radiation are treated as parallel heat transfer mechanisms acting simultaneously.
The PCB is oriented vertically on its longer side so the values of C=1.42 and n=0.25 [3 ]. The height is L=0.114" m". Assuming ΔTo=10∘C, the resulting heat transfer coefficient is ho=4.35 W/m2K.
\begin{equation}
h_c = C \left( \frac{\Delta T}{L} \right)^n
= \frac{C}{L^n} \left( \frac{\Delta T}{\Delta T_0} \right)^n (\Delta T_0)^n
= \frac{C (\Delta T_0)^n}{L^n} \left( \frac{\Delta T}{\Delta T_0} \right)^n
\end{equation}
\begin{equation}
h_c = h_0 \left( \frac{\Delta T}{\Delta T_0} \right)^n
\end{equation}
The radiative heat transfer coefficient is estimated using the Stefan–Boltzmann law.
After a few transformations of Stefan-Boltzmann equation and approximations, the heat flux [4 ] is expressed as:
\begin{equation}
q \approx \sigma \cdot 4 T_a^{3} \left( T - T_a \right) = h_r \, \Delta T
\end{equation}
For Ta=300K, the radiative heat transfer coefficient is hr=6.23 W/(m2 K).
The total heat flux from a node to the ambient is therefore expressed as the sum of the convective and radiative heat fluxes. This allows the definition of a total heat transfer coefficient to be defined as the sum of the convection and radiation coefficients.
\begin{equation}
q = h_r \Delta T_S + h_c \Delta T_S = (h_r + h_c)\,\Delta T_S
\end{equation}
Based on the PCB topology and the dimensions of the heat sources, we estimate the heat fluxes for each node in a manner similar to that shown above. Total power loss is the sum of the power losses in each of the nodes. Based on the obtained values, the power efficiency was estimated. The results are shown in table 1.
Table 1. Power efficiency obtained by electrical measurement, model, and datasheet.

3.Conclusion
The presented method allows estimating power efficiency and power losses based on thermographic measurements. The obtained results agreed with the values provided in the documentation. The inaccuracies in the results may be due to the limited precision of the thermal camera used, the estimation of average temperatures and surface areas, as well as the varying emissivity of components on the PCB. Nevertheless, the results indicate that the proposed method is suitable for estimating power losses. Such a method can be used, for example, to monitor changes in heat loss that occur due to the aging of electronic components. The presented methodology offers several advantages. It requires no circuit modification, permits measurements during normal operation, provides spatial resolution sufficient to identify localized hotspots, and enables longitudinal studies tracking thermal performance degradation over the product’s lifetime. The proposed IR thermography-based approach facilitates both initial design validation and ongoing condition monitoring, supporting predictive maintenance strategies and enhancing overall system reliability.
4.References
[1 ] Julio Lázaro Ramos Martínez, Harold Crespo Sariol, M. Mercedes Pérez de la Parte, B. Sáenz-Diez Pérez, Emilio Jiménez Macías, Jan Yperman, Dries Vandamme, Heat-loss measurement using infrared thermography by multi-threshold analysis, Applied Thermal Engineering, Volume 279, Part A, 2025,
[2 ] Langer, Gregor & Leitgeb, Markus & Nicolics, Johann & Unger, Michael & Hoschopf, Hans & Wenzl, Franz. (2014). Advanced Thermal Management Solutions on PCBs for High Power Applications. Journal of Microelectronics and Electronic Packaging. 11. 104-114. 10.4071/imaps.422.
[3 ] https://www.electronics-cooling.com/2001/08/simplified-formula-for-estimating-natural-convection-heat-transfer-coefficient-on-a-flat-plate/,
[4 ] Więcek, B., & De, M. G. (2011). Termowizja w podczerwieni: Podstawy i zastosowania. Wydawnictwo PAK.
