Choose timezone
Your profile timezone:
The Quantitative InfraRed Thermography (QIRT) Conference is an international forum that brings together specialists from both industry and academia, sharing a common interest in the latest advances in science, experimental practices, and instrumentation related to infrared thermography. Following previous editions held in Paris (1992), Sorrento (1994), Stuttgart (1996), Lodz (1998), Reims (2000), Dubrovnik (2002), Brussels (2004), Padova (2006), Krakow (2008), Québec City (2010), Naples (2012), Bordeaux (2014), Gdansk (2016), Berlin (2018), Porto (2020), Paris (2022), and Zagreb (2024), the 18th Quantitative Infrared Thermography Conference (QIRT 2026) will take place from 29 June to 3 July 2026 at the University of Naples Federico II, Naples, Italy.
QIRT 2026 will cover, and it is not limited to, the following topics:
➽ State of the art and evolution in the field of infrared scanners and imaging systems, allowing quantitative measurements, and related data acquisition and processing.
➽ Integration of thermographic systems and multispectral analysis. Related problems like: calibration and characterization of infrared cameras; emissivity determination; absorption in media; spurious radiations, 3D measurements; certification and standardization.
➽ Analytical and numerical modeling, data reduction and image processing related to infrared thermography also by AI.
➽ Thermal effects induced e.g. by electromagnetic fields, elastic waves or mechanical stresses.
➽ Application of infrared thermography to radiometry, thermometry, and physical parameters identification and quantification, in all fields: fluid mechanics, solid mechanics, structures and material sciences, nondestructive evaluations, electromagnetism, medicine and biomedical sciences, remote sensing, environment monitoring, industrial processes and other.
We are pleased to announce the winners of the Best Young Researcher Presentation Award. This recognition celebrates the outstanding contributions and innovative research presented by early-career scientists during our latest session.
After careful consideration of the scientific quality, clarity of presentation, and impact of the research, the following researchers have been distinguished (in alphabetical order):
We extend our warmest congratulations to all the winners for their excellence and dedication to advancing their respective fields.
Xavier Maldague is a professor at the Department of Electrical and Computing Engineering of the Laval University in Québec (QC), Canada. He has trained more than 50 graduate students (MSc and PhD) and has more than 300 publications. His research interests are in infrared thermography, non-destructive evaluation (NDE) techniques and vision/digital systems for industrial inspection. He holds a Tier 1 Canada Research Chair in Infrared Vision. He is also a chairs of the Quantitative Infrared Thermography (QIRT) Council and a fellow of the Canada Engineering Institute, a Honorary Fellow of the Indian Society of NondestructiveTesting and a fellow of the Alexander von Humbolt Foundation in Germany.
Basic IR Thermography
The presentation will deal with the following topics: introduction, theory (radiometry and heat transfer considerations), modelling for 1D, 2D, 3D geometry in solids materials, thermal stimulations in the active approach, infrared detectors and experimental techniques, deployment, data processing and applications. It is expected this short course will enable the attendees to grasp the fundamentals of IR thermography for non-destructive testing.
Professor Avdelidis (Nico) is a Professor of Aerospace Systems Management in the Department of Aeronautics & Astronautics, School of Engineering at the University of Southampton in the UK. He is also an Adjunct Professor at Universite Laval (Quebec, Canada), within the Department of Electrical and Computer Engineering and the Computer Vision and Systems Laboratory, where he does a lot of his research activities there in collaboration also with other organizations in Canada. Nico has worked both in various academic and industrial environments, managing a growing and vibrant research portfolio. He has successfully developed and delivered various courses on topics such as Autonomous Systems Inspection of Aerospace Structures, Predictive Maintenance Technology, Unmanned Aircraft Systems, as well as served as the Programme Director and/or course Director of MSc courses in the areas of Aviation, Aerospace, and Transport. Nico has contributed extensively to several research areas, such as non-destructive testing and evaluation (NDT&E) of materials and structures, robotic and autonomous systems in aircraft MRO, advanced IR and other non-invasive imaging techniques, and health management of aircraft systems and structures.
IR Thermography in NDT: from Fundamentals to Automation
IR Thermography (IRT) is a non-contact technique that could be applied efficiently for the inspection and/or monitoring of large-area components. It is expected that this short course will enable the attendees to grasp the fundamentals of IR thermography for non-destructive testing (i.e. different modes, configurations, sources, etc) and at the same time go through practical case studies (numerical and experimental) to realize the significance of the technique in NDT. Furthermore, the advantages and limitations of IRT for fully automated and/or autonomous assessments in large areas - structures would also be discussed. Finally, the role of advanced image post processing techniques such as Principal Component Thermography (PCT), Thermal Signal Reconstruction (TSR), etc, in enhancing the accuracy of defect detection in NDT would also be discussed.
Professor Stefano Sfarra attained a Ph.D. title in mechanical, management and energy engineering at the University of L’Aquila (UNIVAQ), Italy, in 2011. Following the achievement of the Ph.D., he was a research fellow at UNIVAQ until 2017, before becoming a researcher in October of the same year.
He carried out research and teaching periods abroad at prestigious institutions all over the world. He was also an invited-scientific researcher at Tomsk Polytechnic University (Tomsk, Russia), as well as a member of several scientific committees at international conferences.
He is also an editor of Infrastructures (MDPI), and Sensors (MDPI). Since December 2020, he is the editor-in-chief (EiC) of the Quantitative InfraRed Thermography (QIRT) Journal (Taylor & Francis). He is deeply involved in the non-destructive evaluation and characterization of materials, especially using optical and infrared vision non-destructive testing techniques, numerical simulations centered on heat transfer phenomena (by Comsol© Multiphysics), development of ad hoc scripts in Matlab©environment, and inverse thermal modelling.
In these research areas, Prof. Sfarra authored or co-authored more than 300 papers in Journals and International Conferences. He also have written seven chapters in Books. He is currently acting as a reviewer of around 50 scientific journals; he is principal investigator, collaborator and local contact person in international research projects.
He is also a member of Associazione MASTER, Associazione Italiana della Fisica Tecnica and Associazione Italiana Proprietà Termofisiche.
He received many awards, mainly focused on scientific recognition.
In October 2020, he became associate professor at UNIVAQ. He has been an adjunct professor at Laval University (Canada).
Infrared thermography for cultural heritage inspection and evaluation
During this short course, a review on the use of ‘infrared vision’ (and in particular of IRT) for the inspection of cul¬tural heritage objects is provided. In particular, a series of experiences done by the speaker together with esteemed colleagues is discussed, the contribution of mock-ups is stressed, and the main current activities of the bilat¬eral Italy-China research project for “science and technology cooperation” (Italian unit: University of L’Aquila, P.I. Prof. S. Sfarra; Chinese unit: Harbin Institute of Technology, P.I. Prof. H. Zhang), titled “sCHans – Solar loading infrared thermog-raphy and deep learning teCHniques for the noninvAsive iNSpection of precious artifacts” (promoted by the Italian Ministry of Foreign Affairs and International Cooperation and co-financed by the Ministry of University and Research, grant number PGR02110) is illustrated.
unther Steenackers is a head of Department of Electromechanics of the University of Antwerp and full professor at InViLab Research Group.
Biomedical Applications of Infrared Thermography
During this short course, an introduction will be given to how infrared thermography can contribute to the identification of (changing) biomedical and biomechanical parameters. Biomedical applications that will be discussed are the identification of skin cancer, the use of thermal cameras in breast reconstructions and blood vessel detection as well as a few biomechanical applications and comfort assessment.
Carlo Salvatore Greco is an Associate Professor of Fluid Dynamics at the Department of Industrial Engineering, Università di Napoli "Federico II". He earned his Master's degree in Aerospace Engineering in 2011 and was awarded a Ph.D. in 2015. In 2016, he joined the University of Naples as a staff researcher. His research focuses on Flow Control, Heat Transfer, and Aerodynamics, utilizing both experimental techniques and numerical simulations. His work is documented in over 30 publications, many of which have appeared in leading international journals such as Aerospace Science and Technology, AIAA Journal, Journal of Fluid Mechanics, and International Journal of Heat and Mass Transfer. He has collaborated with several international research teams within funded programs and is currently leading two scientific projects funded by the Italian Ministry of Research. Since 2013, he has been a member of the International Centre for Heat and Mass Transfer Scientific Committee and the Scientific Advisory Board of the Quantitative InfraRed Thermography Journal.
Thermal Problems in Fluid Dynamics
This short course reviews the evolution of infrared (IR) thermography into a powerful optical diagnostic for complex fluid flows, with an emphasis on measuring surface convective heat fluxes and investigating surface flow-field behavior. The course analyzes steady and unsteady heated thin foil and thin film sensors in various applications, including thermal management with cooling jets, laminar-to-turbulent boundary-layer transition studies, and boundary-layer behavior on propellers. Hands-on examples and case studies will demonstrate how to integrate IR thermography with heat-flux sensors to produce spatially and temporally resolved convective heat-flux maps. The course is aimed at researchers and engineers seeking advanced thermal diagnostics for fluid-flow research.
Yi Liu received B.S. degree in mechanical engineering from Jiangsu University, Zhenjiang, China, in 2004, and the Ph.D. degree in control theory and engineering from Zhejiang University, Hangzhou, China, in 2009. He was an Assistant Professor from 2009 to 2011, then an Associate Professor from 2011 to 2020, both with the Institute of Process Equipment and Control Engineering, Zhejiang University of Technology, Hangzhou, China. He was a Postdoctoral Researcher with the Department of Chemical Engineering, Chung-Yuan Christian University, Chung-Li, from 2012 to 2013. Since 2020, he has been a Full Professor with Zhejiang University of Technology, Hangzhou, China. He has published more than 100 research papers at IEEE Transactions and international journals. His research interests include data intelligence methods with applications to modeling, control, and optimization of industrial processes. Prof. Liu has been serving as an Associate Editor for Quantitative InfraRed Thermography Journal and Acta Automatica Sinica..
The presence of internal defects poses a serious challenge to the structural integrity and performance of composite materials such as polymers and cultural heritage. Active infrared thermography (AIRT) is becoming increasingly attractive among many non-destructive testing techniques due to its low-cost and wide-area coverage advantages. However, thermograms often involve non-uniform backgrounds and measurement noise caused by uneven heating and environmental reflections, necessitating post-processing procedures. Unsupervised machine learning methods have shown promising success in AIRT for defect detection. This presentation aims to provide recent advances on unsupervised machine learning-aided thermography for defect detection. In particular, deep learning methods for thermographic data analysis are reviewed and emphasized. Finally, an outlook on the prospects and potential of these methods is provided.
Numerical simulations developed to understand high temperature industrial processes, such as welding, need to be fed with thermophysical properties of the matter over temperature and with input parameters such as the absorbed part of the laser power, which is usually used as heating source. Literature mentions values of emissivity, which can be approached as the absorptivity through Kirchhoff’s law for given wavelength and direction, but for the wavelength of 645 nm. Therefore, this presentation deals with the development of a three-colour pyrometer dedicated to the measurement of the normal spectral absorptivity of liquid metal at the wavelength of the heating laser (1 070 nm), which can differ from one laser to the other. The absorptivity is a key parameter when a sample is heated by a laser. Among the three wavelengths (λ1, λ2 and λ3), the central one λ2 corresponds to the one of the laser. Signals from wavelengths λ1 and λ3 are used to evaluate the temperature through calibration with a blackbody, and signal from λ2 allows to get the normal spectral absorptivity during experiment with an aerodynamically levitated liquid sample. Methodology is presented for iron, zirconium, and nickel, materials currently used in high temperature industrial processes.
Dynamic thermal infrared imaging remains a challenging task for uncooled microbolometer-based cameras, primarily due to their limited thermal time constants and the resulting motion-induced blur. In order to investigate these effects, we present a compact dynamic laboratory test bench designed to emulate the passage of hot objects from the camera perspective without physically moving heated masses.
The setup relies on stationary heated panels and a self-designed rotating disk featuring apertures. A dedicated design study was conducted to define the angular width and geometry of the disk apertures, taking into account the rotational speed constraints of the brushless motor and the frame rate of the infrared cameras. This design ensures that motion-induced blur remains confined within the projected zones of the thermal panels, allowing its reliable quantification.
The thermal sources consist of two independently heated panels built from high thermal conductivity material to ensure rapid and uniform heat distribution. The panels are covered by a small layer of Nextel Velvet 811-21 paint to ensure a stable and known temperature in the heating range used. Heating is achieved using MINCO HAP6948-1 polyimide heating elements, each integrating a PT1000 temperature sensor. Temperature regulation is performed through a closed-loop PID control scheme implemented using a MAX31865PMB1 RTD-to-digital converter, enabling repeatable temperature control from ambient conditions up to 50 °C. Both the heating elements and the motor are controlled through a Wi-Fi-enabled interface, allowing real-time monitoring and parameter adjustment via a smartphone.
The proposed test bench is used to evaluate and compare two uncooled infrared microbolometer cameras operating at the same spatial resolution. One camera corresponds to a conventional uncooled microbolometer, while the second is a new prototype, built in the BRIGHTER’s framework project, referred to as Fast-Pixel, featuring a thermal time constant reduced by a factor of two, equal to 5 ms. A quantitative image analysis is performed to evaluate motion-induced blur and contrast attenuation under dynamic conditions. Several image quality metrics, including SSIM, RMS contrast, and Laplacian variance, are extracted by comparison with static reference images to characterize spatial image degradation and to assess the impact of the detector thermal time constant on dynamic imaging performance.
Acknowledgments :
BRIGHTER project has received funding from the Chips Joint Undertaking (Chips JU) under grant agreement N°101096985. The JU receives support from the European Union’s Horizon Europe research and innovation program and France, Belgium, Portugal, Spain, Turkey
Ultra-thin recycled polyethylene terephthalate (rPET) polymer films, with thicknesses ranging from 20 to 200 µm, are widely used in applications such as coatings, packaging, surface functionalization, and labelling. Several industrial deposition processes operate at non-ambient temperatures, typically between 20 and 120 °C, making accurate temperature monitoring of these films essential. However, the thermo-optical properties of rPET may vary significantly due to differences in pellet origin, recycling technologies, virgin-to-recycled PET ratios in the formulation, and local thickness variations, which challenges conventional temperature measurement methods.
At such small thicknesses (from 20 to 200 µm), standard infrared thermography is strongly affected by semi-transparency over a broad spectral range (from 0.4 to 20 µm). The thermal flux emanates throughout the entire thickness of the film, which may exhibit an anisothermal temperature distribution. The determination of a precise temperature at a specific physical point within the material’s thickness presents a significant challenge, necessitating the implementation of sophisticated inversion methodologies and multispectral detection techniques that fall beyond the purview of the present study. Secondly, radiation transmitted through the film may contaminate the measured signal, leading to significant temperature errors. These effects become negligible in the infrared only for thicknesses exceeding approximately 1 mm.
This work presents the development of a spectrally selective thermographic method specifically designed for ultra-thin rPET films. The approach relies on the use of an interference filter targeting the strongest infrared absorption bands of rPET, which are associated with the molecular vibrational modes of the polymer. By restricting the measurement to these spectral regions, effective opacity is achieved even for very small thicknesses, thereby restoring the assumptions required for classical infrared thermography.
The study begins with the spectral characterization of rPET using FTIR spectroscopy, enabling the quantitative identification of absorption coefficients (in cm-1) through transmission and reflection measurements. At the selected absorption band, the transparency of rPET diminishes significantly, rendering it effectively opaque when its thickness exceeds 10 µm.
Subsequently, the µ-bolometer technology IR camera FLIR® A655SC, operating in the [7.5-13] µm spectral range, outfitted with the designated interference filter, undergoes calibration across the temperature range [30–150] °C by means of a standardized blackbody reference. The impact of spectral filtering on sensor performance (sensitivity, NEDT, and usable temperature range) is then assessed. Even though the dynamic range of the IR camera exhibits significant degradation, the implementation of an appropriate calibration model effectively minimizes interpolation artifacts, thereby ensuring high fidelity in the resulting data.
Finally, the proposed method is validated experimentally on an ultra-thin rPET film heated by an infrared emitter, with thermographic measurements compared to temperatures obtained from a contact sensor. The observed temperature deviation across the entire thermal range remains consistently below 10°C.
The methodology presented herein demonstrates potential for broader applicability, enabling its extrapolation to alternative polymer film formulations. This approach pave the way for the realization of quantitative temperature-field mapping on semi-transparent polymer films under industrially relevant operational conditions.
Highly concentrated solar radiation can be used in solar-thermochemical water splitting to produce hydrogen as an energy carrier. This production pathway shows a high efficiency potential as an alternative to PV coupled to electrolysis. In solar tower plants, receiver-reactors (like the R2Mx reactor [1]) convert high temperature heat to chemical energy in a two-step redox cycle. At the heart of the process is the redox material, commonly ceria ($\mathrm{CeO_2}$). Firstly, in the reduction step, the redox material is reduced at >1500°C and at low oxygen partial pressure. Secondly, in the oxidation step, at around 1000°C it splits $\mathrm{H_2O}$ to $\mathrm{H_2}$.
Operating the reactor under the extreme temperature conditions is a great challenge that requires detailed monitoring and accompanying simulations. Furthermore, the technology is still in development with optimizations in design and operation playing an important role. For all this, knowledge of the state variables, temperature and reduction extent, of the active redox material is crucial. IR thermography as known from high temperature industries like steel and petrochemical industry can deliver temperature data under controlled conditions. To control the measurement environment, one needs to restrict the background radiation. Secondly, the unknown emissivity of the redox material poses a problem. So far, only measurements at temperatures below 1244°C [2] without attention to reduction extents and room temperature measurements at different reduction extents [3] have been done. These suggest a strong dependence of the emissivity on both the reduction extent and the temperature.
The methodology consists of two parts. (1) The determination of the emissivity and (2) the development of the analysis procedure for the extraction of the state variables, temperature and reduction extent, from the measured irradiance. The latter is done in close cooperation with (3) the application in the reactor environment.
To summarize, the contribution of the work will be high temperature emissivity data at different reduction stages for an often-used redox material, needed for measurement interpretation and optical modelling. Furthermore, a methodology to apply this to the in-situ characterization of the redox material state during reactor operation is developed.
[1] S. Brendelberger, “R2Mx plant model for solar thermochemical hydrogen production at MW scale,” Int. J. Hydrogen Energy 91, pp. 1407–1421, 2024.
[2] L. Gaillard, A. Aouali, P.-M. Geffroy, B. Rousseau, “Développement d'un dispositif expérimental pour la mesure de l'émissivité normale spectrale d'une céramique de CeO2 en conditions de thermochimie solaire,” available online at https://www.sft.asso.fr/sites/default/files/congres/2025/66_doi.pdf, 2025.
[3] S. Ackermann, A. Steinfeld, “Spectral hemispherical reflectivity of nonstoichiometric cerium dioxide,” Sol. Energy Mater. Sol. Cells 159, pp. 167-171, 2017.
The Data Reference Method (DRM) is a method developed at PTB for determining and correcting the non-uniformity of the responsivity of the individual detector elements of two-dimensional resolution cameras. The method is based on an intended horizontal and vertical displacement of the camera in front of a radiation source and the successive recording of several (at least three) offset images of the radiation source. DRM is a scene-based method and does not require any reference sources. As a result, the DRM provides both the non-uniformity of the IR camera system used and the spatial radiation distribution of the radiation source under observation. To determine the non-uniformity of the IR camera, relative information about the response behaviour of the individual detector elements in relation to a freely selectable reference detector element is used, which is derived from the shifted image recordings. However, if the ITS-90 traceable temperature of the radiation source observed by the reference detector element is known, the thermal imaging camera can be absolutely calibrated.
The DRM is a procedure that enables the calibration of thermographic cameras even on inhomogeneous radiation sources, so that the requirements on the calibration source used can be significantly reduced without impairing the resulting calibration quality. The main contribution of the DRM in the calibration process is the improved determination of the non-uniformity of the response behaviour of the thermographic camera over the observed field of view almost independently of the quality of the spatial temperature homogeneity of the applied calibration source.
While, in theory, the method is not introducing an additional calibration uncertainty, in reality there are some restrictions that impair the achievable results. The main practical sources of uncertainty are the temporal stability of the radiance of the source and the responsivity of the thermal imager, i.e. the drift, the positioning precision when taking the images, and the short-term stability (noise) of the measurement. However, under typical conditions in a thermometry lab the DRM significantly improves the calibration and with it the performance of any thermal imager.
In this work, we discuss how these main uncertainty contributions when performing the DRM can be detected, how they can be corrected and give practical tips when performing the DRM. Furthermore, we will compile an uncertainty budget for practical exemplary calibration conditions. As part of the European project EPM JRP “23IND11 ThermoSI - Thermometry with embedded SI traceability for industrial applications”, we will employ a scene-based correction method for non-uniformity even when there is a non-uniform scene and identify the limits when there are e.g., discontinous temperature changes (e.g. sharp edges) that cause artefacts. The results will be compared with an ex-situ non-uniformity correction (i.e. using a reference scene without discontinous temperature gradients in the lab). The preparatory work described here is fundamental for the successful implementation of the DRM approach in the project.
High-lift airfoils operating at low Reynolds numbers are governed by laminar boundary-layer behavior, in which laminar separation bubbles significantly influence lift generation and overall aerodynamic performance. In the existing literature, laminar separation bubbles are generally considered an inherent feature of low-Reynolds-number operation and are often associated with reduced performance and increased sensitivity to operating conditions [2,3]. As a result, classical high-lift airfoil design strategies primarily focus on delaying, mitigating, or minimizing flow separation rather than exploiting it. In the present work, a different design paradigm is explored. A single-element high-lift airfoil is optimized directly at a chord-based Reynolds number of 100,000 using a single-step Deep Reinforcement Learning framework for direct shape optimization, following the approach proposed in [1]. XFOIL is employed as the aerodynamic solver within the optimization loop, enabling efficient evaluation of aerodynamic performance and boundary-layer behavior. Within this framework, the laminar separation bubble is not suppressed but intentionally exploited as a design feature. The optimization promotes and shapes the separation bubble to maximize upper-surface suction levels, leading to lift performance exceeding that of classical low-Reynolds-number high-lift airfoils [2,3].
The optimization is formulated as a multipoint problem around an angle of attack of 4 degrees, with additional conditions at 3 and 5 degrees. Aerodynamic performance is optimized directly, without imposing boundary-layer constraints, resulting in a geometry that sustains a persistent laminar separation bubble in the forward chord region.
The optimized design is investigated experimentally using a combined approach based on planar Particle Image Velocimetry and quantitative Infrared Thermography. Particle Image Velocimetry provides characterization of the external flow field, enabling identification of separation, transition, and reattachment, as well as the associated turbulent kinetic energy distribution. In parallel, quantitative Infrared Thermography is used to reconstruct convective heat transfer through a thin-film sensor model, allowing the derivation of Stanton number distributions.
Separation and reattachment locations inferred from the Stanton number fields are compared with Particle Image Velocimetry measurements and show strong mutual consistency. In particular, reattachment regions identified by peaks in the Stanton number match local maxima of turbulent kinetic energy. Through the Reynolds analogy, the heat-transfer measurements provide indirect access to wall shear stress behavior [4], confirming the physical consistency between experimental observations and XFOIL predictions. The results demonstrate that laminar separation bubbles could be deliberately designed and controlled through airfoil geometry to achieve robust high-lift performance at low Reynolds numbers.
References
[1] Viquerat, J., Rabault, J., Kuhnle, A., Ghraieb, H., Larcher, A., & Hachem, E. (2021). Direct shape optimization through deep reinforcement learning. Journal of Computational Physics, 428, 110080.
[2] Selig, M. S., Low Reynolds Number Airfoil Design, von Kármán Institute for Fluid Dynamics LectureSeries,2003.
[3] Liebeck, R. H. (1978). Design of subsonic airfoils for high lift. Journal of aircraft, 15(9), 547-561.
[4] Carlomagno, G. M., & Cardone, G. (2010). Infrared thermography for convective heat transfer measurements. Experiments in fluids, 49(6), 1187-1218.
Quantitative infrared thermography (QIRT) is employed for non‑intrusive, area‑wide temperature measurements in high‑speed aerodynamic facilities, where accurate surface‑temperature data are essential for determining local heat‑flux densities. A series of wind‑tunnel experiments at the Mach 6 flow condition of the Ludwieg-Tube facility Göttingen (RWG) regarding a 2D shock wave impinging on a transitional flat-plate boundary layer revealed a systematic over-prediction of the heat-flux density (Stanton number). Upstream of the interaction region the experimentally derived Stanton numbers were approximately 13% higher compared to the reference case, a discrepancy exceeding the statistical uncertainty of the measurement and that could not be reconciled with theory or numerical simulations. A dedicated laboratory campaign was therefore launched to scrutinize the infrared camera to identify unconsidered sources of measurement bias.
Two distinct systematic errors were uncovered by observing an object with a fixed temperature and periodically covering a significantly hotter second object in the field of view (FOV). The first error was attributed to lens‑flare effects and manifests as a uniform dependency of the recorded count value, depending on the temperature composition in the FOV. Detailed analysis revealed that the error scales linearly with the mean count value of the image, indicating that multiple internal reflections within the camera optics redistribute radiant energy leading to false temperature recordings. A heuristic correction model was derived by correlating the change in pixel values with the change in the image‑wide mean count, yielding a proportionality factor that could be applied to correct the lens flare effect.
The second error, became apparent after rotating the camera so that the readout direction traversed both the calibrated surface and the hot area. Even after the lens‑flare correction, a residual variation persisted along each readout line, following a perceived parabolic pattern with respect to pixel position. This behavior indicated a coupling between pixels during the line‑wise digitization process. By fitting a simple parabolic function to the observed variation, a correction factor was obtained for each pixel position, effectively decoupling the readout bias from the true signal. Both correction steps are applied in reverse order of the camera’s signal‑processing chain (readout correction preceding lens‑flare correction) to ensure physical consistency.
With both corrections in place, a new temperature calibration was performed using a high‑emissivity black body emitter. The corrected count values were mapped to absolute surface temperatures through a calibrated relationship based on the Stefan‑Boltzmann law.
When the corrected temperature fields are fed into the QIRT heat‑flux algorithm, the previously observed 13 % excess in Stanton number upstream of the shock-wave / boundary-layer interaction disappears and matches the reference curve within the statistical noise. The correction has negligible impact in regions with high heat flux, indicating that the systematic biases are only significant when the temperature changes over time are comparable to the magnitude of the error.
Infrared thermography (IR) is often used in aerothermal testing of turbine components as a non-intrusive technique for accurate measurements of blade surface temperature. Subsequently, measured surface temperatures can be used to derive heat transfer coefficients, adiabatic wall temperatures, and metal and cooling effectiveness.
Recently, an IR system has been successfully deployed to measure the surface temperature on high-pressure transonic turbine blades in the Oxford Turbine Research Facility (OTRF). Rotational speeds of approximately 265 ms-1 create challenging conditions for accurate IR measurements, requiring a compromise between obtaining sufficient detector saturation (dependent on integration time) and minimising image blur [1] [2].
This paper presents methods for improving system accuracy. Firstly, a method for improving system accuracy during significant under-saturation of the detector is presented. This novel pixel-wise calibration correction reduces the discrepancy attributable to low-signal bias between the measured IR surface temperature and reference thermocouples from 17K to 2K across integration times from 1µs and 10 µs using a temperature dependent correction factor in the camera calibration curve. Secondly, measurement uncertainty resulting from motion blur is assessed across integration times from 1µs and 10 µs, and a corrective deblurring algorithm that uses directional deconvolution is presented.
These methods are applied individually and collectively to previously reported OTRF data of blade tip surface temperatures and processed to heat transfer coefficients and adiabatic wall temperatures across a range of iteration times. The overall system uncertainty for the processed quantities is evaluated, enabling the optimal detector operating conditions to be identified.
Overall, the improved calibration method reduces measurement uncertainty in surface temperature from 5% to 1% at the lowest integration time of 1µs with naturally sharper images. Additionally, image deblurring allows data collected at higher integration times to be utilised without introducing significant errors from detector under-saturation, as sharper thermal fields can be reconstructed under high blade rotational speeds.
[1] M. Sisti, C. Falsetti and P. Beard, “High speed infrared thermography to investigate heat transfer of transonic turbine rotor blades,” Measurement, vol. 256, no. 118103, pp. 1-17, 2025.
[2] S. L. Gazzini, R. Schädler, A. I. Kalfas and R. S. Abhari, “Infrared thermography with non-uniform heat flux boundary conditions on the rotor,” Measurement Science and Technology, vol. 28, no. 025901, pp. 1-15, 2017.
A variety of experimental techniques has been developed to analyse the aerodynamics of immersed bodies, classified based on their measurement principles. Specifically, phenomena like transition and separation have been observed through different experimental techniques, such as oil flow visualization, the use of pressure and temperature sensitive paint, Particle Image Velocimetry and Infrared thermography. The latter has gained widespread attention due to its non-intrusive nature and has been established as a valuable tool for thermo-fluid-dynamics research. As a matter of fact, separating–reattaching flows exhibit pronounced variations in near-wall flow behaviour that lead to substantial changes in the convective heat transfer coefficient [1]. When the surface temperature exceeds that of the surrounding air, these local variations in convective heat transfer manifest as measurable surface temperature gradients, which can be directly associated with the evolution of the underlying flow field [2].
All the experiments are carried out in a subsonic open-circuit wind tunnel with a rectangular test section of $300$ mm × $400$ mm, with a contraction ratio of $10$ and appropriate screens put at the entrance of the inlet nozzle to ensure a low turbulence intensity level ($0.1 \%$) in the test section.
The tested models are symmetric NACA airfoils, for which the angle of attack is varied, while the Reynolds number is set to $Re_c={10}^5$. A FLIR X6980-HS Infrared camera is used to acquire the temperature maps in each investigated condition. In order to obtain sufficient thermal contrast, the airfoil models are uniformly heated by halogen lamps. Moreover, estimates of the Stanton number are inferred by applying the thin film sensor model to the airfoils. Two-component planar PIV is used to provide benchmark estimates of the mean locations of separation, transition, and reattachment.
A good agreement was found between the estimation of the locations of separation and transition obtained through Infrared thermography and from PIV measurements. Most of all, the results demonstrate the capability of surface temperature measurements to identify and quantify the location of a laminar separation bubble, which is a predominant flow field feature for airfoils at low Reynolds number.
References
[1] Spalart, P. R., and Strelets, M. K., “Mechanisms of Transition and Heat Transfer in a Separation Bubble,” Journal of Fluid Mechanics,Vol. 403, Jan. 2000, pp. 329–349.
[2] Gartenberg, E., and Roberts, A. S. J., “Twenty-Five Years of Aerodynamic Research with IR Imaging,” Journal of Aircraft, Vol. 29, No. 2, 1992, pp. 161–171. 10.2514/3.46140
Thermal imaging offers a unique opportunity to study gas/vapour–liquid mass transfer processes and liquid-phase hydrodynamics. In this work, we develop quantitative infrared thermography (QIRT)-based methods for the study of flowing liquid films under absorption and distillation conditions.
Depending on the system under study, the thermographic outcomes are two-fold. For semi-transparent liquids in the long-wave infrared range, such as selected organic solvents and their mixtures, the recorded signal contains information related to local film thickness distribution and hydrodynamic patterns.
If infrared-opaque liquids are studied (typically aqueous systems and alcohol mixtures), information about the liquid–vapour interface temperature of the film is acquired, which opens possibilities for the evaluation of local interfacial mass transfer intensity distributions, active interfacial area assessment, or monitoring of thermal effects of chemisorption. These techniques are not sufficiently developed, and the corresponding quantities are experimentally inaccessible under distillation conditions, leading to significant uncertainties and simplifying assumptions in current distillation models.
This specific application of quantitative infrared thermography is associated with substantial radiometric challenges. Observed gas–liquid systems must be closed with IR-transparent windows. Moreover, if there is a layer of vapour between the film and the window, the observed system is complex, and the obtained thermograms must be carefully evaluated using a specifically developed radiometric model. This model takes into account absorption and emission of the vapour, apparent absorption of the window caused by multiple internal reflections at the optical interfaces, and reflected background radiation from the surroundings. Additionally, both the liquid and vapour phases often behave as spectrally selective emitters, which must be accounted for in quantitative analysis.
This contribution focuses on the influence of the vapour layer and the window in the optical path between the target and the camera on the apparent temperature measured by the camera during observations of infrared-opaque liquid films. A radiometric evaluation model and methodology are developed to reconstruct the true liquid–vapour interface temperature of the radiating liquid film under distillation-relevant conditions. The experimental apparatus, consisting of multiple parallel KBr windows and a layer of semi-transparent vapour with controlled temperature between them, is employed for model validation. The results demonstrate the necessity of detailed radiometric modelling for reliable quantitative thermographic measurements in distillation-relevant gas–liquid systems, as well as the applicability limits of this methodology.
The non-destructive testing (NDT) sector within aerospace composites is predominantly an end-process inspection approach and composite manufacturers report approximately 30% failure rates at the end-process inspection. Although some surface damage can be repaired, irreparable sub-surface defects usually cause high volumes of materials waste. Despite the benefits of identifying defects early, in-process inspection is not common in aerospace composites due to the high cost and slow speed of traditional NDT methods such as ultrasonic testing. High speed automated active thermography could make in-process inspection viable. Infrared Active Thermography (IRT) combines a thermal imaging camera with an excitation source to quickly measure a components temperature gradient response. This temperature gradient is administered by an excitation source as thermal waves, which flow into the material via diffusion. As a defect will have different thermal properties to the sound material, the diffusion rate differs between defect and sound material. This disparity allows for the quantification and detection of material damage. Therefore, IRT can be classified as non-contact and in turn has significant advantages other types of NDT techniques. However, the parameters associated with the excitation source are still an area of on-going research. These parameters include temporal (Pulse Duration, Excitation Frequency), energetic (Energy Density, Source Power, Spectral Range) and spatial (Heating Uniformity, Scan Velocity, Stand-off Distance) components and it is non-trivial to generalise these parameters for differing material and geometric variables, especially when the aim is quantitative analysis. The goal of this work is to compare between different IRT techniques, to facilitate the inspection of Carbon Fibre Reinforced Polymer (CFRP) components commonly seen in the aerospace sector. The techniques are quantitatively compared, in terms of effectiveness and efficiency when scanning representative aerospace grade composites that contain a wide range of defect depths and shapes.
Inductive thermography is a non-destructive testing technique widely used for detecting surface and near-surface defects in electrically conductive materials. In ferromagnetic steels, the interaction between electromagnetic induction, material properties, and defect geometry produces localized thermal variations that can be detected by infrared imaging. The characteristics of the thermographic response are influenced by several factors, including defect size, depth, and orientation, as well as by the excitation and measurement conditions.
This work presents an investigation of the influence of crack geometry on the inductive thermography response in ferromagnetic steel, considering both surface and subsurface simulated cracks. Artificial open cracks with controlled geometrical parameters are introduced into steel specimens in order to analyse the effect of variations in length, depth (surface and subsurface), and inclination on the measured thermal signal. Different measurement approaches, namely pulsed and lock-in combined with Fast Fourier Transform (FFT) processing, are adopted to characterize the cracks quantitatively, with particular emphasis on phase information, which is generally less sensitive to non-uniform heating and surface emissivity effects than temperature amplitude.
The experimental configuration is designed to provide stable and repeatable induction heating, enabling a consistent comparison between different crack geometries. Different experimental set-ups, excitation coil geometries, and infrared cameras have been investigated to study the influence of key parameters and to identify the main limitations affecting defect detectability and characterization.
A numerical modelling approach was employed to simulate a broader range of crack geometries and to evaluate the corresponding inductive thermography response, thereby gaining insight into crack behaviour while reducing the amount of experimental data and the number of specimens required for different crack geometries. Experimental measurements were used to support and validate the simulations in different set-up scenarios, showing that inductive thermography enables the detection and characterization of surface and sub-surface simulated cracks, with the phase response exhibiting measurable and repeatable variations as a function of crack geometrical parameters.
Overall, this study highlights the versatility of inductive thermography for assessing surface and sub-surface simulated cracks in ferromagnetic steel. The experimental results serve as the basis for subsequent comparative experimental–numerical investigation, enabling more extensive parametric analyses and supporting an improved probability of detection and crack characterization in different inspection configurations.
This study presents an extended infrared thermographic investigation of cold-sprayed 316L stainless steel coatings subjected to different post-spray heat-treatment temperatures. The primary objective of the work was to reliably differentiate coatings processed at distinct heat-treatment temperatures, namely as-sprayed (no heat treatment), 600 °C, 800 °C, and 1000 °C, which are known to induce systematic changes in coating porosity and microstructure. Flash-pulse thermography was employed as a non-contact and non-destructive technique to evaluate these thermally induced modifications. Particular attention was given to practical challenges such as non-uniform heating and surface curvature, which commonly occur in real industrial components and complicate thermographic interpretation.
A comparative evaluation of thermographic data-processing techniques was conducted, including Pulsed Phase Thermography (PPT), Thermographic Signal Reconstruction (TSR), Principal Component Analysis (PCA), and machine-learning–based classification models. Each method was assessed in terms of its ability to suppress artefacts caused by uneven thermal excitation and curved surfaces, while preserving informative signals related to coating condition. Phase-based analysis received special attention due to its inherent robustness against spatially non-uniform heating.
The experimental results demonstrate that phase responses obtained by pulsed phase thermography exhibit clear and systematic trends with respect to heat-treatment temperature. In particular, distinct peaks in the phase-frequency domain were observed, whose positions and amplitudes correlate with the applied heat-treatment temperature. These phase characteristics reflect changes in the thermal diffusivity of the coating, which are primarily governed by heat-treatment-induced variations in porosity and inter-particle bonding. Importantly, phase analysis was shown to effectively compensate for the influence of non-uniform heating and surface curvature, enabling reliable comparison between coatings with different geometries.
Additional thermographic indicators derived from TSR coefficients and PCA components were also analysed. Several of these metrics exhibited measurable sensitivity to heat-treatment temperature, although their robustness to heating artefacts varied across methods. Machine-learning approaches were employed as supervised classification models to automatically distinguish coatings processed at different temperatures based on thermographic features. The classification results demonstrate the potential of data-driven methods for automated assessment of coating condition, provided that sufficient and representative training data are available.
To validate the thermographic findings, the results were compared with metallographic analyses of coating cross-sections obtained by optical microscopy. Quantitative and qualitative porosity assessments derived from polished sections showed agreement with trends identified in the thermographic data. Coatings subjected to higher heat-treatment temperatures exhibited reduced porosity and more homogeneous microstructures, which corresponded to systematic shifts in thermographic phase characteristics. This comparison confirms that infrared thermography can indirectly capture microstructural changes in cold-sprayed coatings through their thermal response.
Overall, the study demonstrates that infrared thermography, and pulsed phase thermography in particular, is a robust and sensitive tool for the non-destructive characterization of cold-sprayed metallic coatings. Its ability to compensate for non-ideal heating conditions and to distinguish coatings with different heat-treatment histories highlights its strong potential for industrial quality control, process optimization, and in-line inspection of cold spray coatings.
Pseudo-noise–based pulse-compression thermography has become an increasingly attractive alternative to conventional pulsed and lock-in approaches, as coded excitations enable high deposited energy while retaining broadband frequency content. However, practical implementation requires careful consideration of the inherent DC component introduced by the unipolar nature of the applied heating.
While explicit DC-removal procedures are typically required, this study shows that Legendre sequences can be modified such that they provide intrinsic DC-offset auto-compensation during correlation-based reconstruction. The natural offset cancellation achieved during matched filtering removes the need for polynomial DC-fitting or measurements near thermal steady-state conditions, thereby simplifying the processing chain while maintaining the full benefits of pulse-compression.
These findings highlight a practically relevant advantage of pseudo-noise thermography: the ability to simultaneously access high SNR, long-duration coded heating, and robust DC-offset suppression of the thermal excitation without additional modelling steps.
Composite helmets are made from a combination of durable synthetic fibers, such as Kevlar (aramid) and ultra-high molecular weight polyethylene, bonded with resins. Composite helmet manufacturing involves layering successive layers in a mold, then heating and subjecting them to hydraulic pressure, creating an integral, robust helmet shell. Structural damage to the helmet can occur both during production and during use. To extend its service life, the entire batch of helmets should be evaluated. Only non-destructive testing allows for the examination of an entire batch of helmets and the identification of those with internal structural damage that reduces their ballistic resistance. Due to the shape of the helmet shell, ultrasonic thermography is the most effective method for detecting defects. To verify whether the type of defects detected using ultrasonic thermography significantly reduces the helmet's ballistic resistance, we use the V50 destructive testing method. The V50 method in ballistics is a standard procedure for testing the ballistic resistance of materials. It involves determining the velocity at which, on average, 50% of projectiles penetrate the material and 50% stop (or partially penetrate), thus defining the material's protective limit in accordance with military standards. This article presents selected results of non-destructive testing of composite helmets after many years of use and their verification using the V50 destructive method.
Analysing infrared thermal (IRT) images objectively in the fields of biomedicine is always a challenge, especially when there is biological bilaterality. It is common for these images to be analysed by regions of interest (ROI) and attempts made to compare them to provide an objective interpretation. For several decades, the concept of thermal symmetry based on the difference between the average temperatures of the ROI has been used, but this has also been the subject of debate. To provide an answer to this discussion it is aim of this research to determine from the available mathematical methods (Root Mean Square Error, Wasserstein Distance, Jensen-Shannon Divergence, Structural Similarity Index, Mutual Information and Kolmogorov-Smirnov Test), which can be more suitable to add objectivity to the analysis of thermal symmetry in IRT images. From this experiment it can be concluded that from the studied ROIs similarity assessment methods in the tested sample, the most feasible for discriminating healthy and pathological grades are Structural Similarity Index and Kolmogorov-Smirnov Test. However, it is recommended to test the proposed approach in a larger sample for better understanding.
Introduction:
Thermal heating of the skin using infrared lasers has been a valuable tool in pain research for multiple decades. Recently we have developed a closed-loop thermography-controlled system which allows accurate temperature control during moving laser stimulation. Using this setup the thermal energy transduction is no longer limited to transversally across the skin, but the movement causes a significant longitudinal transduction as well. Thus, the aim of this study was to model and understand how the skin and thus receptors are heated during stimulation and how long temperature increase remains within the tissue.
Method:
Infrared (IR) thermography data from 8 healthy participants (Rujoie et al., 2023) was used in this study. The experimental data contained both open and closed-loop stimulations and two laser stimulation intensities, 42 and 46°. During open-loop the power setting was kept fixed during stimulation (based on trial and error to obtain a target temperature) whereas during closed-loop control the laser power was continuously adjusted based on IR thermography. The stimulation was delivered to the volar forearm and had a length of 100mm and velocity of 10mm/s. A three-layer finite element model was used to investigate the temperature profiles within the tissue during stimulation (Frahm et al., 2010, 2020; Lejeune et al., 2023), tissues were epidermis, dermis and hypodermis. Power and other settings in the model were based on the experimentally used values in our previous study.
Results:
For the 42 and 46°C stimulation intensities, the experimental open-loop average power settings were 8.5 ±0.3 and 13.6±0.5W respectively, and for closed-loop the average power settings (which varied during stimulation) were 11.6±2.4 and 16.4±2.8W respectively.
The average skin temperature for the 42 and 46°C targets were 39.5 ± 0.9°C and 44.1±1.3°C for open-loop respectively, and 42.0±0.5 and 46.0±0.8°C for the closed-loop respectively.
The model showed that when simulated the average temperature during open loop the surface temperature the simulated skin surface temperature matched the temperature targets (~42 and ~46°C respectively), whereas for closed-loop the simulated temperatures were 44.4 and 48.2°C, respectively. For the 46°C stimulation the temperature in deeper tissues (1.35 mm from the surface) reaches more than 51°C.
Furthermore, the model showed that deeper tissues were heated to an even higher temperature than what was observed on the skin surface. This is interesting as this could lead to a higher degree of neural activation that expected, furthermore, the risk of skin damage will increase, and this must be considered for safety aspects. Finally, the energy in the tissue took more than 10 seconds to return to baseline.
Conclusion:
This study shows that heating of the skin is very complex and even using the power settings which the model indicates to be optimal, the experimental temperature was still off target. Conversely, simulating the average power during closed-loop infrared diode-laser stimulation indicated a much higher deeper tissue temperature than desired. This is due to the complexity of tissue thermo-dynamics which will vary during stimulation. Thus, closed-loop control is essential to ensure uniform and less variable temperature profiles.
Several diseases, including rheumatoid arthritis and cancer, are associated with localized increases in tissue temperature. This characteristic suggests that thermal imaging could be exploited for diagnostic and monitoring purposes, which led to the development of the field of medical thermography. However, when a localized hot-spot is situated more than ~15 mm beneath the skin and its temperature exceeds that of the surrounding tissue by 1–3 K, as is the case in medical conditions, the resulting change in surface (skin) temperature is typically of the order of tens of mK. Such small temperature variations of skin temperature approach the sensitivity- stability limits of commercial uncooled thermal cameras. When combined with environmental, instrumental and systematic uncertainties, these factors can render conventional two-dimensional thermography and thermal tomographic imaging unreliable.
To overcome these limitations it is necessary to minimize instrumental errors and other experimental uncertainties. A controlled and well monitored environment, combined with a structured data acquisition and analysis protocol, is essential for obtaining measurements of the required precision. We have designed and constructed an experimental setup that maintains a stable environmental temperature, has adequate monitoring and calibrating sensors, and minimizes infrared radiation reflections from external sources.
The dedicated experimental space and instrumentation, in conjunction with the adopted calibration and data acquisition protocol, allowed for thermal images to be obtained with the required precision and accuracy, over extended intervals (up to a few hours) during which small ambient temperature variations between successive acquisitions were allowed. Furthermore, reference surfaces within the thermal camera’s field of view during image acquisition enabled post-processing corrections that further reduced spatial and temporal fluctuations arising from instrumental and environmental factors. Using this setup and approach, we achieved an overall uncertainty of 25 mK.
We tested the suitability of this setup and methodology for medical thermal tomography using hardware phantoms. In these experiments, we successfully detected hot-spots with small temperature differences (ΔT < 2 °K, above surrounding medium) at depths of up to 30 mm. These results demonstrate, that a controlled experimental setup, together with the suitable calibration and data acquisition protocol, provides the conditions required to make thermal tomography feasible.
Background and Aim: Thermal imaging is widely used to assess skin temperature. However, interpretation often relies on absolute values or qualitive patterns that provide limited insight into spatial thermoregulatory organization. Palm-to-finger thermal gradients (PFG) capture temperature distribution of the hand which reflects vascular tone and peripheral thermoregulation in response to a variety of physiological or pathological states. However, standardized, quantitative descriptors for palm-to-finger thermal gradient patterns and their population-level variability have not been established. The current study was designed using automated, deep-learning analysis to identify and characterize PFG phenotypes in an active population and determine their prognostic association with demographic and hand load and exposure variables.
Methods: Thermal and optical images of the hands were acquired using a FLIR C5 camera under controlled, indoor conditions. Participants were seated with hands exposed to ambient room temperature (22-25 °C) and allowed to equilibrate thermally for at least 5-minutes prior to imaging. During acquisition, participants positioned their hands approximately 1–2cm above a standardized hand template to ensure consistent posture and minimize conductive heat transfer. Joint localization and multimodal image alignment were performed using a customized, automated pipeline integrating deep-learning–based computer vision tools (Meta’s Segment Anything Model and Google’s MediaPipe HandLandmarker) with joint detection performed using a ResNet50-based convolutional neural network trained on annotated thermal images. Skin temperatures were extracted automatically at each hand joint, and PFGs were computed (ΔCenter–MCP, ΔCenter–PIP, ΔCenter–DIP). Unsupervised k-means clustering was applied to identify distinct hand thermal gradient phenotypes. The dataset included 139 participants (mean age 44.7±11.7 years; BMI 26.7±4.4 kg/m²; 109 men, 30 women). Demographic and hand load and exposure parameters were evaluated using the Jonckheere–Terpstra trend analysis and Somers’ D ordinal-association test.
Results: Four phenotypes were characterized according to absolute temperatures and PFG’s. The coldest cluster showed steep PFG’s (center 26.3 ± 2.1°C; ΔCenter–DIP 6.9 ± 1.4°C); whereas the warmest cluster exhibited nearly flat PFG profiles (center 33.6 ± 1.4°C; ΔCenter–DIP 1.4 ± 1.5°C). Increased body weight and BMI were associated with significant monotonic increases (from colder to warmer) across PFG clusters (Jonckheere–Terpstra test, both p < 0.001). Age and height did not show significant ordered correlations with these thermal phenotypes. Dominant hand laterality was associated with the warmer phenotypes (Somers’ D, p = 0.037). Biological sex was not significantly associated with phenotype rank. Hand load characteristics—including subjective load score, weekly procedural time, and daily computer use—also were not associated significantly with phenotype rank (all p > 0.18).
Conclusion: Using deep-learning automated analysis, we identified and characterized distinct palm-to finger thermal gradient phenotypes that establish reference patterns within the study population. This approach provides a reproduceable quantitative framework for objective assessment of peripheral thermoregulation that might be useful as an additional patient specific prognostic tool in the evaluation of progression and efficacy of treatment of a variety of physiological and pathological states.
To understand heat transfers in complex system, three-dimensional temperature measurements is a powerful source of information. Various techniques exist, optical, electromagnetic, or scanning thermal microscopy, generally falling into two categories: two-dimensional measurements together with inverse methods, or direct 3D measurements requiring fewer assumptions and potentially handling more complex geometries [1].
Semi-transparent media are ubiquitous in many practical applications used in our everyday technologies. One can cite the semiconductor materials such as silicon, or microfluidic systems used in biology, chemistry and energy, where temperature critically impacts device performance and reveals indications about the ongoing physics or chemical reactions. For instance, in polymerase chain reaction (PCR) DNA amplification, which only works under precise temperature control, the need for accurate 3D temperature mapping is evident. Achieving this in microfluidics remains challenging and needs to solve both geometrical (a few millimetres-thick) and optical (multiple light reflections and absorptions) constrains to develop a new 3D temperature measurement method [2].
This study fills this gap and proposes a system that enables 3D measurement of temperature elevation fields in a semi-transparent system: a microfluidic chip (PDMS, water, silicon). To do this, a new laminographic method based on transmission photothermal heterodyne imaging (TPHI) is used in the mid-IR range. It is based on the principle that the reflectance and absorbance of incident light shed in a medium vary with its internal temperature. The increase in signal-to-noise ratio achieved by using a heterodyne method overcomes the problem of material (PDMS, water…) refractive index sensitivity to the temperature [3]. The transmitted signal is then measured for different angular positions of the sample using a laminography device in order to reconstruct the 3D field at microscale (below 20 µm3/voxel), and using a SIRT reconstruction algorithm [4]. Compressive sensing to reduce the acquisition time during the 3D laminography is also used to speed up the measurements to less than 1 h.
In this communication, we will show the imaging of a 3D elevation temperature field due to laser beam excitation in a microfluidic chip component. The complete methodology, theoretical thermo-optical model and signal processing (reconstruction and compressive sensing) will be exposed. This work shows the recent advances made for measurement in microfluidic systems and for semi-transparent media in general, despite the fact that the proposed method is limited optically to a purely absorbing medium (without scattering) and to the observation of relative temperature elevation.
References
[1] R. Chen, B. Shi, K. Song, M.M.Z.G.C. Lok, M. Jiang, S. An, P. Tao, B. Fu, C. Song, J. Wang, T. Deng, W. Shang, Advances in Three-Dimensional Temperature Sensing: From Materials to Applications, Advanced Materials. (2025).
[2] C. Bourgès, J. Maire, S. Chevalier, S. Dilhaire, Surface and average volume temperature measurements in semitransparent media based on multispectral thermotransmittance, Int J Heat Mass Transf. 234 (2024) 126087.
[3] J. Letessier, A. Netter, J. Maire, S. Chevalier, Infrared Photothermal Heterodyne Imaging in Thermally Thick Medium for Thermo-optic Property Characterizations, J Phys Chem Lett. (2025) 11987–11995.
[4] J. Gregor, T. Benson, Computational Analysis and Improvement of SIRT, IEEE Trans Med Imaging. 27 (2008) 918–924.
Among infrared thermal characterization techniques, scanning photothermal radiometry (SPR) stands out as an active technique that is simultaneously non-destructive, contactless, and allows for temporal resolutions on the order of nanoseconds and spatial resolutions down to the submicrometer scale, lower than 0.5µm [1]. It relies on measurements at different frequencies to investigate different depths of the sample under study. The drawback of this technique is that, as a scanning method, it can be time consuming to measure a 2D image at various frequencies while still keeping a large field of view and a small scanning step as usually at least 30min per frequency are needed in low noise scenarios for a precise map of a $50\times50$ µm area. This make it challenging to use as a screening method for instance.
In this work we show that it is possible to reduce the amount of measurements taken by 3 when using the SPR technique on a sample consisting of carbon fibers in an aluminum matrix. To achieve this reduction, leading to an equivalent reduction in measurement time, we rely on the general principle of compressive sensing [2,3], which is based on a few assumptions usually verified for most images that aren’t pure noise, among which the most important is the sparse nature of the measured signals. Compressive sensing has been previously used for single pixel imaging [5], i.e., reconstructing images from measurements with a mono-detector, or for increasing the number of pixels in an image.
Here, we specifically apply this technique to thermal measurements. Practically, we randomly undersample the measured image. We then accurately reconstruct the full image thanks to an $\ell_1$ norm minimisation algorithm. This compressive-sensing-based algorithm makes it possible to overcome the Shannon sampling limit of the equivalent regularly sampled image. We verify that the hypotheses required, such as the sparsity of the signal, are valid and compare the reconstructed image for different sampling ratios. We observe that it is possible to reconstruct the features of the sample with as little as 30% of the measurements while keeping the error low. In this communication, we will then discuss the specificities of using such technique in thermal characterization, in which thermal diffusion can filter out high frequency features, such as the fiber/matrix interfaces.
Handling infrared cameras is often challenging due to the diversity of manufacturers and communication interfaces. Although camera communication may rely on generic standards such as GenICam, it frequently depends on vendor-specific Software Development Kits (SDKs) and proprietary software. As a result, integrating custom algorithms and building reproducible processing pipelines across different camera models becomes difficult. Switching between proprietary tools is inconvenient and can be particularly cumbersome when managing multiple cameras simultaneously, especially in laboratory environments.
To address these challenges, a modern Python-based framework IRLab for infrared camera handling has been developed. It provides a generic Application Programming Interface (API) that allows interaction with most infrared cameras available on the market, using either standard protocols or vendor-specific SDKs when required. The primary advantage of this framework is the provision of a unified interface that abstracts away vendor-specific implementations, enabling code reuse across camera models and simplifying the integration of new devices into existing codebases.
Thanks to its open-source nature and modular design, the framework facilitates the rapid integration of new camera models. Once core camera functionalities are implemented, the API automatically exposes parameter configuration, recording management, and live streaming capabilities via WebRTC or RTSP for instance.
Building on this API, a web-based interface has been developed to automatically scan for and discover supported cameras connected to the system. This interface provides a user-friendly environment for planning image or video recordings and interacting with multiple cameras through a single, unified control panel. When deployed in server mode, it also enables remote camera monitoring and control.
Moreover, a generic and sustainable approach must also account for the entire data life-cycle: how data are acquired, stored, accessed, processed, and archived. This consideration is especially critical for field instrumentation, where reliability, scalability, and long-term data management are essential. Current developments [1] enable such possibilities to make dataset management efficient and secure for collaborative research projects, while considering diverse data types, sharing requirements, and compliance regulations.
In this work, we first introduce the newly developed IRLab generic framework. We then describe its integration with previous developments for large-scale dataset management. Finally, a concrete use case is presented to illustrate the capabilities of the proposed approach, before outlining directions for future developments.
BRIGHTER has received funding from the Chips Joint Undertaking (JU) under grant agreement No 101096985. The JU receives support from the European Union’s Horizon Europe research and innovation program and France, Belgium, Portugal, Spain, Turkey.
The history of satellite observations of fires and flares in the infrared from space extends back to the 1970's. Most of the products relied on detection with a midwave infrared spectral band near 4 um and a longwave infrared band in the 10-12 um range. These data products are referred to as "hotspots" as it is impossible to calculate temperature or source area for subpixel heat sources from a single spectral band. In 2012, a new style of multispectral infrared emitter data product was developed based on nighttime infrared data from the NASA/NOAA Visible Infrared Imaging Radiometer Suite (VIIRS). This data product, known as VIIRS Nightfire (VNF), detects infrared emitters such as wildfires, natural gas flares, and steel mills. VNF relies on near-infrared and shortwave-infrared radiances from spectral bands designed for daytime imaging of reflected sunlight. At night, these spectral bands record the sensor's noise floor and clusters of high radiance pixels associated with infrared emitters at the Earth's surface. Temperature, source area, and radiant heat are calculated for each VNF-detected pixel using physical laws, including Planck's Law, Wien's Displacement Law, and the Stefan-Boltzmann Law. Multiple years of VNF data are composited to identify fixed location infrared emitters. The emitter sites are labeled for type and nightly temporal profiles are generated back to 2012. The temporal profiles are updated once per week. The data are currently used in estimating flared gas volumes. Temporal profiles are available from a webmap service known as the Global Infrared Emitter Exlorer (GIREE). We currenly track more than 20,000 emitters worldwide. VNF is the largest global infrared monitoring system gas flaring and industrial waste heat.
Ceramic additive manufacturing enables the layer-by-layer fabrication of complex ceramic components, usually through an indirect process involving debinding and sintering. Material Extrusion (MEX) is a promising and cost-effective method in which a ceramic-loaded pellet feedstock is extruded to produce a green part. This approach offers high material efficiency, process flexibility, and strong potential for industrial-scale ceramic manufacturing. Alongside these advances arises the need to demonstrate that such additively manufactured ceramic components meet safety and reliability requirements.
This study focuses on active infrared thermography, a non-destructive testing method that is gaining increasing relevance due to its rapid inspection capability, need for only one-sided access (reflection mode), and high sensitivity to subsurface defects. The effectiveness of active thermography is influenced by several factors, including environmental conditions, intrinsic material properties such as surface emissivity, and operator-dependent parameters such as experimental setup and scanning strategy.
In this work, a robotized line-scan thermography approach is investigated. This technique enables precise and repeatable scanning of components by maintaining uniform inspection conditions through robotic control. The high repeatability allows for systematic evaluation of independent variables and their influence on defect detection and quantitative assessment.
The effect of thermal excitation is evaluated in this study through multiple line-scans, using a heating source with adjustable focus to apply different energy levels to the surface of the inspected components. Analysis of the acquired thermographic sequences identifies optimal excitation parameters that enhances defect detection in the additively manufactured ceramic materials considered. A comparison with other NDT methods was done, to show the prospects offered by such adapted use of line-scan thermography.
Induction thermography is a type of active infrared thermography where eddy currents are induced in a specimen, leading to Joule heating of the specimen. The thermal image of the specimen captured by an infrared camera can be used for defect detection in non-destructive testing (NDT). Both surface cracks and subsurface defects can be detected due to the interaction between the defect and the eddy currents as well as the thermal diffusion, causing the surface temperature to deviate from the pattern obtained in sound areas. Pulse heating may be applied for defect detection, but amplitude-modulated heating can be applied for lock-in thermography to enhance the signal-to-noise ratio [1].
In order to study the effect of the many parameters that influence induction thermographic NDT, numerical modeling proves to be a valuable tool. Indeed, computer simulations avoid the costly and time-consuming task of producing samples with artificial defects and allow finer control over parameters such as defect dimensions than is possible with manufactured defects. Building on our long-standing experience in eddy current computations [2] within the CIVA simulation platform [3], dedicated to the simulation of inspection techniques by a variety of excitation sources, we are currently developing a 3D model for the complete induction thermography measurement chain: eddy current generation, thermal diffusion and thermal radiation towards the infrared camera. The goal is to give access to key quantities of interest in CIVA, such as the measured temperature evolution over time and the phase contrast, while keeping the overall simulation time limited.
In this contribution, we will present a coupled eddy current and thermal diffusion model and compare the simulation results with experimental data. The eddy current solver relies on the Boundary Element Method and computes the heating power at the surface of the specimen. The computation of the heating power in the volume of the specimen can be performed but is computationally expensive, and can only be afforded in a small region around the defect. Consequently, a simplified model for the volumetric heating is used in the defect-free region to provide the input to the (volumetric) thermal solver. The validity of these approximations will be demonstrated by comparing simulation results with data from typical induction thermography NDT setups. We will show that the numerical model allows to correctly predict the influence of NDT parameters (material properties, induction frequency, defect dimensions, etc.) on key observables such as the differential and phase contrast.
References
1. Oswald-Tranta, B.: Detection and characterisation of short fatigue cracks by inductive thermography. Quantitative InfraRed Thermography Journal 19(4), 239–260 (2022).
2. Bonnet, M., Demaldent, E.: Eddy-current asymptotics of the Maxwell PMCHWT formulation for multiple bodies and conductivity levels. Computers & Mathematics with Applications 141, 80-101 (2023).
3. EXTENDE: CIVA, NDT Simulation Software. Available at: https://www.extende.com/civa-ndt-simulation-software/ (Jan. 2026).
Detection and characterization of delaminations and adhesion defects remains a challenge in many industries, applications and materials: from manufacturing defects and low impact damage in composites, to quality control of new bonding technologies such as magnetic pulse welding of dissimilar metals. Optically excited lock-in infrared thermography (IRT) has shown a high potential to size the depth and thickness (thermal resistance) of ideal uniform delaminations. In this work, we show the potential of lock-in IRT to size the depth, lateral dimensions and thickness of more realistic delaminations featuring smooth variations of the parameters along the defect. The methodology is based on solving a parameter estimation problem that relies on a two-dimensional model of the delamination. The surface temperature is calculated semi-analytically by applying the cosine Fourier transform together with the quadrupoles method. The model parameters (depth, length and thickness of the delamination) are determined by fitting the model to experimental data obtained on samples containing calibrated delaminations. For this purpose, we have manufactured artificial delaminations with smoothly varying length, depth or thickness and combinations of two of them in AISI-304 stainless steel. The experimental campaign includes lock-in thermography experiments on a variety of specimens at several frequencies. The real and imaginary part of the complex surface temperature, obtained from experimental amplitude and phase data, are the inputs to fit the two-dimensional theoretical model to estimate the length, depth and thickness of the artificial delaminations. The consistency of the results was checked on each sample by fitting data taken at different frequencies. It has been found that in AISI 304- stainless steel, the depth of delaminations down to 3 mm can be sized accurately. The length of the delaminations has been obtained with accuracies better than 10% and the thickness remains the most challenging parameter to be determined. In AISI-304, delaminations up to 50-60 microns thick can be sized accurately but sizing thicker delaminations is difficult because the contrast between damaged and sound regions saturates and the sensitivity decreases. This maximum sizable thickness would be higher (lower) in materials of lower (higher) thermal conductivity. We think that these findings boost IRT as a reliable technique for the characterization of real delaminations.
Non-destructive testing (NDT) techniques are essential for evaluating the integrity, reliability, and safety of engineering components without impairing their serviceability. NDT methods are widely employed in critical industrial sectors such as power generation, aerospace, manufacturing, and infrastructure, where early detection of defects can prevent catastrophic failure and reduce maintenance costs. Among the various NDT techniques, thermal-based methods have gained increasing importance due to their capability to detect surface and subsurface anomalies in a rapid, full-field, and non-contact manner.
Infrared thermography is a well-established thermal NDT technique that enables spatial and temporal measurement of temperature variations associated with material inhomogeneities and defects. In conventional active infrared thermography, external thermal excitation is applied to a specimen, and the resulting transient thermal response is monitored using an infrared camera. Defects such as voids, cracks, and inclusions disturb heat flow within the material, producing detectable thermal contrasts on the surface. The effectiveness of this technique strongly depends on the characteristics of the thermal excitation source, including its intensity, duration, uniformity, and spectral properties.
While extensive research has focused on optimising excitation power, heating time, and post-processing algorithms, the influence of excitation source colour temperature on defect detection has received limited attention. In this study, an experimental investigation is conducted to evaluate the effect of colour temperature on defect detectability in mild steel using an active infrared thermographic technique. LED-based lamps with adjustable colour temperature capability are employed as the thermal excitation source due to their stability, energy efficiency, and spectral controllability.
The colour temperature of the LED lamps is systematically varied over a predefined range, while all other experimental parameters, such as excitation power, heating duration, infrared camera settings, inspection geometry, surface condition, and ambient environment, are maintained constant. This controlled approach enables the isolation of the colour temperature effect on the specimen's thermal response. A mild steel sample containing artificially induced defects of known geometry and depth is used to ensure repeatability and objective comparison.
Thermal data are acquired during both heating and cooling phases using a calibrated infrared camera. The recorded thermograms are analysed with a primary focus on the signal-to-noise ratio (SNR), which serves as the quantitative metric for comparing defect detectability across different colour temperature conditions. SNR values are calculated by comparing the thermal responses of defective regions with those of sound areas. The experimental results reveal that colour temperature significantly influences thermal contrast generation and defect visibility, with certain colour temperature settings yielding higher SNR values and improved defect discrimination.
The findings demonstrate that optimising colour temperature can enhance defect detection performance in conventional infrared thermographic NDT without increasing excitation energy, inspection time, or system complexity. This study highlights colour temperature as a critical yet often overlooked parameter and provides practical guidance for improving thermographic inspection sensitivity. The outcomes contribute to quantitative infrared thermography research and support the development of more efficient and adaptable NDT systems for metallic components.
The aim of the presented research was the development of a non-destructive method for automatic verification of the operating temperature of a semiconductor device. The primary objective was to correctly classify a device into one of two categories: packages with a junction operating at an excessively high temperature and packages with a junction operating within the acceptable temperature range. In addition, the proposed algorithm was required to detect and indicate local areas of the package surface exhibiting elevated temperatures relative to the surrounding regions. The investigated component was the MBR2550CT device, consisting of two semiconductor diodes with a common cathode enclosed in a TO-220 package. The core of the experimental setup was an ImageIR 8300hp infrared camera (Infratec, Dresden, Germany), featuring a spatial resolution of 640 × 512 pixels, a detector pitch of 15 μm, a spectral range of 1.5–7.5 μm, and a noise-equivalent temperature difference (NEDT) of 25 mK. The camera enabled image acquisition at 335 Hz in full-frame mode or up to 5000 Hz using subwindowing. The system was complemented by a current source, ammeter, and voltmeter, while the camera was mounted on a tripod and operated using IRBIS 3.1 Professional software. To validate the thermographic measurements, a Pt1000 temperature sensor (Vishay Intertechnology, Malvern, PA, USA) in a four-wire configuration was attached to the observed package area. The sensor was housed in an SMD 0805 package and glued using WLK 5 adhesive (Fischer Elektronik, Germany) with known thermal conductivity. During the experiments, currents of 1.25 A, 2.5 A, 3.5 A, 4.35 A, and 4.88 A were applied to one diode junction. For each current level, 100 thermograms were recorded. Measurements were performed on six devices, resulting in a total of 3000 thermograms. To establish the relationship between package temperature and junction temperature, an additional MBR device (not used in the main experiments) was physically opened, allowing precise internal measurements. This enabled the creation of a three-dimensional model and thermal simulations in the SolidWorks environment. As a result, the junction temperature Tj was estimated based on the thermographically measured case temperature Tc. The junction temperature of 70 °C was arbitrarily selected as the acceptable operating limit, corresponding to a case temperature of Tc = 58.9 °C. Using the Arrhenius model, it was shown that reducing the junction temperature from 150 °C to 70 °C decreases the aging rate by approximately 169 times (AF ≈ 0.0059 for Ea = 0.8 eV). Based on these thresholds, the thermograms were divided into two classes: correct operation (Tj < 70 °C, Tc < 58.9 °C) and incorrect operation (Tj ≥ 70 °C, Tc ≥ 58.9 °C). The resulting dataset consisted of 1500 thermograms for each class. Temperature matrices were extracted and processed, and the RetinaNet algorithm achieved a classification accuracy exceeding 90%.
Pulsed Thermography (PT) has established itself as a robust non-destructive evaluation (NDE) technique for inspecting industrial materials. However, the automated detection and characterization of subsurface defects in polyvinyl chloride (PVC) components present distinct technical challenges compared to metals or carbon fiber composites. PVC is characterized by low thermal conductivity, high reflectivity, and variations in emissivity, which frequently result in thermograms with low signal-to-noise ratios and blurred defect edges due to lateral thermal diffusion. Consequently, relying on manual interpretation by human experts is often inefficient and prone to errors for this material class. To address these limitations, this study proposes an automated defect segmentation framework that integrates advanced signal processing with a Transformer-based neural architecture.
The proposed methodology begins with data preprocessing using Thermographic Signal Reconstruction (TSR). The raw temporal temperature sequences for each pixel are fitted in the logarithmic domain using polynomials and converted into first-order derivative images. This transformation effectively suppresses temporal noise and mitigates the effects of non-uniform heating, significantly enhancing the thermal contrast of internal anomalies. To capture complex dependencies, spatio-temporal features are extracted pixel-by-pixel using spatial windows (e.g., 3×3) across the temporal evolution. This approach allows the model to analyze the correlation between a central pixel and its surrounding neighbors, compensating for the "blurring" effect caused by heat diffusion in the PVC structure.
The core of the framework is a Transformer network that employs a multi-head self-attention mechanism to dynamically weigh the importance of global and local features, enabling precise segmentation of defect morphology. Recognizing that deep learning performance is highly sensitive to hyperparameter configuration, this study moves beyond traditional manual tuning or random search methods. Instead, a Bayesian optimization stage is implemented to automatically tune the network. This probabilistic approach efficiently navigates the search space to identify the optimal combination of learning rate, batch size, and attention heads, thereby maximizing the model's generalization capability while reducing computational costs.
Experimental validation was conducted on PVC specimens containing artificial flat-bottomed holes of varying diameters and depths. The results demonstrate that the proposed framework, optimized via the Bayesian approach, achieves superior performance in terms of robustness and precision. The method yields high values in Pixel Accuracy (PA) and Intersection over Union (IoU) metrics, outperforming architectures based solely on Convolutional Neural Networks (CNN) or Recurrent Neural Networks (RNN/LSTM). These findings confirm the framework's potential for automated quality assurance in the manufacturing of PVC components.
Improving aircraft availability while ensuring structural integrity has made the optimization of aeronautical maintenance a major industrial challenge. Current inspection methods do not reliably detect the most critical defects and are often too time-consuming to significantly reduce aircraft ground time.
Since 2018, an extensive experimental campaign has been conducted on lightning-struck composite plates protected by various lightning strike protection systems. These specimens were inspected using flash infrared thermography to detect subsurface defects, primarily delaminations. The resulting database, built over several years, includes a wide variety of composite materials (thermoset and thermoplastic matrices), different resin systems, and configurations with or without protective coatings.
In continuity with recent studies carried out at ONERA, the objective of this work is to contribute to the integration of artificial intelligence techniques to enhance infrared image processing algorithms developed at ONERA. The focus is placed on the detection of delamination defects in composite materials through the implementation of unsupervised learning algorithms, with the long-term objective of automating non-destructive testing (NDT) and enabling its future robotization.
Most segmentation approaches reported in the literature rely on supervised deep learning architectures such as U-Net and primarily exploit spatial information. However, strong thermal contrasts not related to delamination can lead to false detections. To overcome this limitation, the present study focuses on the temporal thermal signal rather than spatial supervision.
Two types of unsupervised algorithms are investigated: a one-dimensional Variational Autoencoder (1D VAE) and diffusion-based models. The 1D VAE is designed to model the temporal dynamics of each pixel, allowing the learning of normal thermal behavior while remaining sensitive to deviations induced by subsurface defects. Diffusion-based models are the State-of-the-Art approach for image generation, which iteratively learn to denoise random samples for signal/image synthesis. The capability of these models to capture complex data distribution makes them promising in the context of infrared thermal physics. Consequently, they are explored for the task of anomaly detection on thermographic images.
These algorithms were first validated on a semi-analytical synthetic database generated from quadrupole simulations. Virtual infrared sequences were created for 2 mm-thick composite plates, including both sound areas and centrally located defects at various depths and signal-to-noise ratios. The methods were then applied to experimental infrared thermography sequences acquired after lightning strike impacts. The experimental database contains more than one hundred infrared sequences.
The performance evaluation focuses on detection-oriented criteria rather than classical segmentation accuracy. Although the F1-score is adopted to quantify the ability of the proposed methods to distinguish defective from sound areas, commonly used segmentation metrics such as Intersection over Union are deliberately not considered. Indeed, IoU is poorly suited to infrared thermography data, as the reference annotations are affected by heat diffusion after thermal excitation and therefore do not accurately represent the physical extent of the defects. By relying on the F1-score, the evaluation framework emphasizes detection reliability while reducing sensitivity to thermally induced spatial spreading, enabling a more meaningful comparison of the proposed unsupervised approaches.
In Germany, more than 130,000 m³ of low- and medium-level radioactive waste – approximately 90% of the national inventory – is stored in 200-liter steel drums at interim storage facilities. At present, the integrity of these drums is assessed primarily through manual visual inspection of the outer surface. While this approach can identify surface-visible corrosion, it cannot detect corrosion caused internal material loss threatening the integrity of the drum and is inherently limited in terms of objectivity and information depth.
This study investigates infrared thermography as a non-contact remote non-destructive testing (NDT) method for the detection of internal defects in metallic radioactive waste drums. In practical inspection scenarios, thermographic measurements are strongly influenced by surface-related artifacts, including scratches, dirt, labels, multiple paint layers with low thermal conductivity, and the curvature of the drum surface. These factors distort heat propagation and reduce defect contrast, significantly limiting the effectiveness of conventional thermographic post-processing.
To overcome these limitations, advanced thermal signal processing methods – specifically principal component thermography (PCT), pulse phase thermography (PPT), and thermal signal reconstruction (TSR) – are combined with machine learning techniques to enhance defect detectability under realistic conditions. Instead of relying on individual post-processing outputs, multiple thermographic representations are used jointly to extract complementary spatial and temporal features that are more robust to surface artifacts.
Different machine learning strategies are investigated for defect identification and segmentation. Classical decision-tree-based methods, including decision trees and random forests, are evaluated using feature vectors derived from processed thermographic data. In parallel, several neural network architectures are explored, ranging from shallow convolutional neural networks with a limited number of layers to more advanced encoder–decoder architectures such as U-Nets. These models are trained to exploit spatial context and multi-channel thermographic inputs obtained from combined post-processing methods. The results demonstrate that integrating thermographic signal processing with data-driven learning improves the visibility and separability of defect-related signals across samples with varying surface conditions, compared to thermographic post-processing alone.
The study highlights the potential of combining infrared thermography with machine learning to extend the capabilities of current inspection practices beyond purely visual assessment. The presented approach provides a foundation for more reliable thermographic evaluation of radioactive waste drums and supports the development of automated NDT workflows for challenging industrial inspection scenarios.
Introduction
Several methods have demonstrated the use of terahertz waves to estimate the mass diffusion coefficient under transient conditions. Monitoring transient water content is recognized as a key parameter in many drying processes (e.g., wood, paper, etc.). Some techniques allow water content to be measured locally – for example, in geology, where time-domain reflectometry (TDR) is commonly employed 1. This technique has been successfully used to monitor the progression of a wetting front in dry soils gradually moistened by irrigation.
For food product, accurate control of water content remains essential to ensure product quality and to extend their shelf life. In this study, terahertz waves are employed to locally measure the water content in a cereal-based product
Terahertz (THz) radiation, by contrast, is non-ionizing and thus safe for use in food and biological systems. It refers to electromagnetic waves with frequencies ranging from approximately 0.15 to 5 THz.Moreover, THz radiation is strongly absorbed by water and reflected by metals—properties that make it particularly suitable for investigating moisture distribution in complex matrices.
Experimental device
The experimental setup consists of a commercial Terahertz scanner distributed by Terasense (San Jose, CA, USA). The Terahertz Imaging Scanner system comprises two main components: a linear Terahertz imaging camera and a 100 GHz Terahertz generator. Both components are optimized and synchronized. THz radiation is efficiently delivered from the generator to the camera sensor (256 pixels, up to 5000 lines/sec). The camera pixel size provides an image resolution of 1.5 mm2. The sample to be analyzed was transported along a conveyor belt (Figure 1), with the Terahertz source positioned above the belt and the line camera mounted below.
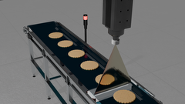
Method
A freshly prepared muffin was cut into slices of equal thickness and placed on a plastic sheet, which was then conveyed between a Terahertz source and a line scanner to measure the attenuation associated with both the solid matrix and the contained water. Subsequently, the slices were dried in an oven to remove moisture, and a second scan was performed to obtain the attenuation corresponding solely to the solid matrix. The ratio of the two transmittance images was then used to generate a 2D map of the water content in each slice. Finally, by assembling all slices, a 3D visualization of the water distribution within the muffin was reconstructed.

Results

Each slice shown in Figure 3 represents the local water content integrated over the thickness of the slice. Thus, the information obtained per slice allows the water content in different regions of the muffin to be estimated with a resolution of 6 mm. By integrating the data from all slices, the average water content across the entire thickness of the muffin is obtained, providing volumetric information per voxel. Using a principle analogous to X-ray tomography, the 3D volume is reconstructed from an average of the information collected by the detector.
Conclusions
This results provides detailed insights into the spatial distribution of water within a porous food matrix, complementing conventional techniques that typically quantify only global moisture content. While other methods, such as Near-Infrared (NIR) imaging, can also offer local water content information [21], Terahertz imaging provides additional advantages: it is rapid and non-ionizing, making it particularly suitable for industrial applications in food quality control and process monitoring.
References :
1. Walczak A., Szypłowska A., Janik G., Pęczkowski G.: Dynamics of volumetric moisture in sand caused by injection irrigation physical model, Water, Switzerland, 13 (11), art. no. 1603 (2021).
2. Ledieu J., De Ridder P., De Clerck P., Dautrebande S.: A method of measuring soil moisture by time-domain reflectometry Journal of Hydrology Volume 88, Issues 3–4, Pages 319-328, (1986).
The increasing complexity of industrial systems in the aeronautical sector, together with strict safety, reliability, and energy efficiency requirements, is driving the development of new advanced monitoring and predictive maintenance strategies. In this context, infrared thermography has established itself as a key technology for non-destructive inspection, enabling continuous, real-time, non-contact thermal measurements without interfering with the normal operation of equipment. Its integration with architectures based on the industrial Internet of Things (IoT) and artificial intelligence is of particular interest within the Industry 5.0 paradigm, characterized by the search for more resilient, sustainable, and human-centered industrial systems.
The scope of this study focuses on the development of a predictive monitoring and control system based on distributed industrial IoT devices, infrared sensors, and flow meters, applied to an industrial machine used in material certification processes in the aeronautical sector. The main objective is the early identification of possible wear and deterioration in electrical resistors, as well as the detection of gas fuel leaks in the supply line, through the combined analysis of thermal and energy consumption information.
The proposed solution is based on a network of industrial IoT devices integrated into the plant infrastructure and communicating via standardized industrial protocols. The network nodes incorporate infrared sensors for monitoring the temperature of the resistors, as well as flow meters for quantifying the fuel consumption associated with the thermal process. The system is designed using a hybrid approach, in which data acquisition is performed locally, while intensive processing and advanced analysis are performed in a separate computing center, facilitating scalability, interoperability, and cybersecurity.
Infrared thermography plays a central role in the study as a key sensor for the early detection of anomalies. Deviations in the measured thermal patterns may be associated with aging processes, material degradation, or incipient failures in the resistors. Complementarily, fuel consumption analysis using flow sensors allows deviations from expected behavior to be identified, potentially linked to efficiency losses or leaks in the line. The combination of both sources of information provides a more complete and robust view of the machine's operating status.
Based on the recorded data, a multimodal artificial intelligence model is being developed that can estimate the status of the machine and anticipate abnormal situations. This model learns the correct behavior of the system and exploits the correlations between thermal and consumption variables to improve early detection capabilities compared to approaches based on individual sensors, supporting informed decision-making by operation and maintenance personnel.
This study highlights the potential of infrared thermography integrated with IoT and artificial intelligence to advance toward smarter, more resilient, and sustainable predictive monitoring systems in the aeronautical sector, contributing both to improved operational safety and to the optimization of maintenance costs and energy consumption.
INTRODUCTION Zero-Defect Manufacturing (ZDM) is an emerging European industry paradigm focused on reducing waste and costs while maximizing product quality. Non-Destructive Inspection (NDI) systems integrated into production lines enable proactive quality assessment. This work presents openZDM project results, focusing on InfraRed Thermography (IRT) across three industrial use cases. The research demonstrates how thermographic data, integrated into an open platform based on RAMI4.0 and Asset Administration Shell standards, drives real-time decision-making, enabling efficient ZDM implementation.
USE CASES AND METHODOLOGIES Advanced IRT solutions were deployed in three pilot lines:
1) VDL Weweler, production of trailing arms for heavy vehicles by hot-forming of steel bars: two thermographic NDIs were installed to measure the temperature profile of the product and residual oxidation (scale) after the induction furnace and the descaling unit. Calibrated for high temperatures (about 1200°C), these sensors ensure the steel bars meet specific thermal requirements before hot-forming.
2) APTIV, EV battery production: for the assembly of electric vehicle battery trays, a thermography-based system was implemented to inspect the welding process. The system utilizes AI-driven models to analyze thermal cooling patterns and spatial attributes, identifying welding defects such as missing welds or irregularities.
3) VIDRALA, glass container manufacturing: in the hot-end forming stage, where bottles reach temperatures of approximately 700°C, a dual-camera setup was deployed. This system captures infrared emissions to indirectly estimate the wall thickness of the bottle and predict defects 45 to 90 minutes before the cold-end quality control.
RESULTS AND DISCUSSION The implementation achieved significant successes while also highlighting practical limitations.
At VDL Weweler, the thermal cameras successfully provided real-time data to the digital twin, enabling process parameter recommendations. However, the hostile environment due to extremely high temperatures requires continuous diagnostic strategies in the system. Acquisitions are made during a thermal transient that must be considered and corrected.
In the APTIV use case, the integration of IRT with data-driven quality modules achieved a defect detection rate of nearly 99%. The system has been operational for over a year, though it has required iterative hardware improvements regarding refrigeration and camera positioning to withstand the industrial environment.
For VIDRALA, the IRT models demonstrated high correlation for thickness prediction at specific control points. Nevertheless, the challenges encountered are related to the ability to generalize the model to all mold cavities and to ensure the representativeness of the data for complex cases and to have a sufficiently large dataset in the whole range of thickness values for training the neural model.
CONCLUSION The openZDM project demonstrates that IRT is a mature enabler for ZDM when supported by robust data platforms. Different thermographic systems have been designed and developed for various industrial contexts to improve efficiency and effectiveness, successfully addressing the challenges encountered in different scenarios. While AI models fed by thermal data proved highly effective for defect prediction, successful deployment requires addressing on-the-edge challenges, including network latency, hardware durability, and the scalability of calibration models across variable production conditions.
As semiconductor packaging advances toward high density integration and heterogeneous integration, internal packaging defects such as voids, cracks, and interconnect failures become increasingly concealed. Conventional active infrared thermography (AIT) is constrained by thermal diffusion in packaging materials, which makes accurate localization and depth resolved interpretation of internal defects difficult. This paper proposes a multi harmonic infrared thermal tomography (MH-ITT) method based on electrothermal feedback induced nonlinearity. The proposed method requires no external thermal excitation. By applying a DC bias superimposed with a single tone AC excitation, the temperature dependent resistance of semiconductor devices triggers electrothermal coupling nonlinearity and naturally generates higher order harmonic thermal responses inside the device. Theoretical analysis and simulations indicate that different harmonics correspond to different effective thermal wave frequencies and thermal diffusion lengths. Therefore, they provide depth distributed tomographic slices. Experiments on a failed microcontroller unit (MCU) demonstrate that the proposed method enables three dimensional characterization of an internal hotspot in a packaged device. The proposed method provides an efficient and physically interpretable approach for three dimensional nondestructive inspection and fault reproduction of internal defects in packaged semiconductor devices.
This presentation follows earlier work on the simultaneous estimation of the thermal conductivity components and heat capacity of orthotropic materials. The original innovation lays in demonstrating the feasibility of performing an experiment capable of simultaneously visualizing, using a single infrared camera, four faces of the same parallelepiped orthotropic material: the heated surface and three other surfaces in the principal directions. A 3D analytical model was developed using Fourier-type integral transformations in the three spatial directions. Tests estimating the thermal properties of an arbitrary material were then performed using simulated and noisy temperatures derived from the direct model A key feature is that the functional considered temperatures in all three directions simultaneously. Furthermore, the minimization relied on temperatures integral transformed over the surfaces. Bayesian inference was used for the estimation. Since computation times can be long with this method, a weighted ranking of each mode was used to reduce the number of modes required. This presentation elaborates on the three experimental, numerical, and estimation aspects. A sensitivity study is first proposed to validate the use of a multi-observable functional. Subsequently, estimation tests are presented using simulated data, first without and then with noise, via the COMSOL Multiphysics® finite element software for a material with balsa properties. Balsa is thus tested experimentally, and the resulting temperatures are transformed using the same protocol in order to estimate the three thermal conductivity components and the heat capacity. The results are then discussed, particularly the direct model and the boundary conditions, given the significant computation time due in part to the large number of pixels specific to each face.
The increasing complexity of advanced materials with anisotropic thermal properties necessitates more generic and efficient methods to determine three-dimensional (3D) anisotropic thermal conductivity tensors with up to six independent components. Current methods rely on a vector-based framework that can handle only up to four independent components, often leading to inefficiencies and inaccuracies. We introduce Three-Dimensional Spatially Resolved Lock-In Micro-Thermography (3D SR-LIT), a novel optical thermal characterization technique combining a 3D tensor-based framework with an efficient area-detection experimental system. For simple tensors (e.g., x-cut quartz, k_xz=k_yz=0), our method reduces uncertainty by over 50% compared to vector-based methods. For complex tensors with six independent components (e.g., AT-cut quartz), 2σ uncertainties remain below 12% for all components. A novel adaptive mapping approach enables high-throughput data acquisition (40 seconds to 3 minutes, depending on tensor complexity), over 35 times faster than current methods, and accommodates samples with 200 nm surface roughness. Extensive numerical validation on 1,000 arbitrary anisotropic tensors ranging from 1 to 1,000 Wm^(-1) K^(-1) further validates the robustness of this methodology. This work highlights significant advancements in thermal characterization of complex anisotropic materials.
Porosity in Laser Powder Bed Fusion (L-PBF) aluminium alloys strongly influences heat diffusion mechanisms and, in turn, the mechanical behaviour of additively manufactured components. This motivates the development of non-destructive approaches capable of probing porosity through thermophysically meaningful quantities. This study presents a preliminary investigation on the use of thermal effusivity, estimated by pulsed laser thermography, as a proxy for porosity in L-PBF AlSi10Mg.
Bi-layer specimens were manufactured by intentionally combining a nearly dense surface layer with a porous substrate, obtained through systematic variations of hatch spacing during the L-PBF process. Localized pulsed laser spot thermography in reflection mode was employed to generate transient thermal fields, which were recorded by an infrared camera under controlled boundary conditions. The measured temperature decays were analysed using an effective bi-layer inverse thermal model, allowing the estimation of the in-depth thermal diffusivity of the dense surface layer and the thermal reflection coefficient at the layer–substrate interface. These parameters were subsequently used to derive the effective thermal effusivity of the porous substrate.
The reconstructed effusivity shows a clear, monotonic dependence on porosity, whereas the thermal diffusivity of the dense surface layer remains nearly constant across the investigated specimens. Since porosity is known to govern stiffness and strength in L-PBF AlSi10Mg, the observed effusivity trends suggest a potential link between thermographically estimated thermal parameters and porosity-driven variations in mechanical properties, without requiring direct mechanical testing. Although the present results are limited to a preliminary dataset, they demonstrate the feasibility of using thermal effusivity as an indirect indicator of porosity. The proposed approach highlights the potential of pulsed laser thermography combined with bi-layer modelling as a physics-based framework for non-destructive porosity assessment in L-PBF aluminium alloys, paving the way for future extensions towards comprehensive thermo-mechanical validation.
Dr. Mathias Ziegler brings over 20 years of hands-on experience in thermography to his work. He earned his PhD in Physics in 2009 for his research on high-power laser diodes. Since 2010, he has been with the Federal Institute for Materials Research and Testing (BAM). There, his focus has been on laser-based active thermography, and he has served as the Head of the Thermographic Methods Division since 2022. Beyond his research, Mathias is deeply committed to the practical application and reliability of thermography through standardization, an area he has been actively shaping for over a decade. He currently serves in leading roles, including convenor for CEN/TC 138/WG 11, convenor for ISO/TC 135/SC 8/WG 5, and chair of the German DIN committee for thermographic testing.
Standardization is a fundamental prerequisite for the successful transfer of new Non-Destructive Testing (NDT) technologies, particularly active thermography, into concrete industrial applications. While research drives innovation, standardization creates the necessary technical, legal, and economic basis to make these procedures objective, reproducible, and independent of the specific user. Without uniform standards, the in-dustry faces a lack of trust, comparability, and compatibility, which significantly hinders the broad acceptance and dissemination of new processes. Recognized standards are therefore crucial for meeting safety and quality requirements—especially in regulated sectors like aviation and medical technology—while simultaneously reducing invest-ment risks for companies and accelerating approval and certification processes.
This contribution provides a comprehensive look at the current status and future de-velopments of thermography standardization at both European and international lev-els. We offer insights into the effective work of the responsible European committee, CEN/TC 138/WG 11 “Thermographic testing.” Current efforts include the revision of the basic standard for active thermography, EN 17119, to ensure it remains fit for the fu-ture, as well as projects focusing on inductively excited thermography and testing with pulsed optical energy sources. On the international stage, under ISO/TC 135/SC 8, similar efforts are underway to update the nomenclature of infrared thermography (ISO 10878) and to develop the first globally harmonized application standard for active thermography with laser excitation, based on EN 17501.
However, the transition from research to application often reveals gaps that impede implementation. Users of modern testing technologies increasingly demand recog-nized reference test specimens, reference procedures, and the metrological assurance of test equipment. Addressing these needs is vital for establishing trust in daily indus-trial operations. Looking ahead, the roadmap for standardization must evolve to reflect industrial realities. Once fundamental standards defining the testing methods are es-tablished, future work must extend beyond specific applications, such as weld testing, to address the integration of automation and Artificial Intelligence (AI) compatibility into the testing workflow.
Finally, this presentation emphasizes that standardization is not the task of a closed circle but relies on consensus and the active participation of experts from industry, ac-ademia, and service providers. We invite the community to engage in this collaborative process. By translating expertise into universally applicable rules, standardization acts as the essential bridge that transforms innovative technologies into verifiable, econom-ically viable, and widely adopted industrial processes.
This study evaluates the effectiveness of an Automated Defect Recognition (ADR) system for aeronautical composite structures through the integration of active infrared thermography and Deep Learning–based image analysis. The research aims to assess not only the performance of the computational model but also the reliability of the inspection technique itself when applied to diverse and increasingly complex composite material configurations. Given the extensive use of composite materials in modern aircraft structures, ensuring the robustness and repeatability of automated non-destructive evaluation (NDE) systems across different laminate architectures is essential for guaranteeing structural integrity and operational safety. The experimental campaign focused on carbon fiber reinforced polymer (CFRP) laminates, as well as hybrid composite configurations incorporating fiberglass layers and metallic lightning protection foils. These hybrid structures introduce additional electrothermal and optical complexities that challenge conventional inspection and automated analysis methods. To establish a comprehensive and controlled testing baseline, both internal and surface discontinuities were intentionally introduced into the specimens. These defects were simulated using foreign object inclusions embedded between laminate plies and precision machining techniques applied at predefined depths and geometries. Data acquisition was performed using active infrared thermography in both reflection and transmission modes, allowing the assessment of defect detectability under different heat flow conditions. This dual-mode approach enabled a more complete evaluation of thermal contrast variations associated with subsurface defects, particularly in the presence of heterogeneous material interfaces and metallic layers. For the computational analysis, a U-Net convolutional neural network architecture was employed to perform semantic segmentation of defects. The model was trained and validated on a dataset comprising approximately 3,000 thermographic images, collected from the different laminate configurations and inspection setups. Special emphasis was placed on evaluating the robustness of the network in maintaining spatial accuracy and precise defect boundary delineation despite the variability in thermal signatures caused by distinct material combinations and structural arrangements. The results, quantified using the Intersection over Union (IoU) metric, demonstrated a high segmentation efficiency of 97.72% for standard CFRP laminates. Importantly, the system maintained strong performance when applied to hybrid composite structures, achieving an IoU of 93.98%, along with a Recall of 98.86% and an F1-Score of 96.90%. These results indicate that the proposed ADR system is capable of accurately identifying and localizing defects even under challenging electrothermal interference conditions introduced by metallic foils. Overall, the findings validate the effectiveness of combining active thermography with Deep Learning–based semantic segmentation for automated defect detection in aeronautical composites. The demonstrated robustness across multiple laminate architectures supports the potential standardization of this integrated NDE approach for aerospace inspection applications.
Laser Powder Bed Fusion (L-PBF) of aluminum alloys is highly sensitive to local thermal conditions, where subtle variations in melt pool dynamics can lead to defect formation such as lack of fusion, porosity, or gas trapping. Detecting and characterizing such defects during the build process remains a key challenge for in-situ monitoring systems. In this work, an infrared thermography (IRT)–based monitoring framework combined with the extraction of suitable thermal features and physics-informed machine learning is presented for the detection and characterization of imposed typical Additive Manufacturing (AM) defects intentionally introduced in the CAD design of specimens produced via Laser Powder Bed Fusion process (L-PBF). The aim of this work is to identify and characterize these defects with an online non-destructive evaluation approach, without, without requiring a post-process inspection.
L-PBF experiments were monitored on AlSi10Mg powder using an off-axis microbolometer infrared camera to capture thermal image sequences during multi-layer fabrication. The thermal data were first processed to remove the countering scan strategy and to extract the spatial footprint of the printed cube using maximum-temperature projections. For each layer, a binary printing mask was generated to exclude background and powder spreading effects. Pixel-wise temporal temperature signals within the printed region were then analyzed.
To handle scan-order effects, each pixel’s thermal signal was aligned to its local heating peak, converting absolute time into an event-based reference frame. From the aligned signals, physics-informed thermal features describing the local heating and cooling behavior were extracted, including peak temperature, heating rate, early-time cooling slope, exponential cooling time constant, goodness-of-fit of the cooling model, and dwell time above a thermal threshold. These features encode melt pool stability, heat dissipation efficiency, and thermal consistency of the process parameters closely linked to defect formation mechanisms in L-PBF.
As a preliminary approach and with the aim of an automatic defect identification, unsupervised defect identification was performed using a Gaussian Mixture Model (GMM). Initially, clustering was applied on a per-layer basis to identify distinct thermal behavior regimes within individual layers. To enhance sensitivity to imposed defects and avoiding phenomena related to multi-pass strategy and edge effects, a multi-layer aggregation strategy was then introduced, where pixel-wise features were combined across several consecutive layers to form thermal history descriptors for each spatial location. Clustering these multi-layer descriptors enabled the identification of persistent anomalous regions that correlate with the imposed defect geometries defined in the CAD model.
The extraction of physics-informed thermal features, together with the resulting feature-based cluster maps, revealed spatially coherent regions aligned with the imposed defects, exhibiting abnormal cooling behavior and poor exponential fit quality that were not apparent in single-layer analyses. These regions aligned with the known locations of imposed defects, demonstrating the capability of the proposed approach to detect defect signatures for an on-line non-destructive evaluation. Further analyses were than carried out to extract information regards defect characterization, considering different defect geometries and type of typical AM defects.
The study demonstrates the effectiveness of infrared thermography combined with physics-informed thermal feature analysis and a machine learning approach for in-situ L-PBF process monitoring and defect identification and characterization, paving the way toward intelligent, data-driven quality assurance in additive manufacturing.
Vibrothermography (VT) has emerged as an effective non-destructive testing technique for detecting barely visible impact damage (BVID) in composite materials. This work investigates vibrothermographic inspection of impact damage in carbon-based composites using fixed-frequency and frequency-sweeping ultrasonic excitation, enhanced by machine learning algorithms. Experiments were conducted on specimens with low-energy impact damage down to 5 J. Ultrasonic excitation was applied via piezoelectric transducers across multiple frequency ranges, while infrared thermography captured thermal responses. Machine learning models were trained on thermal image datasets to automate defect detection and classification, significantly improving detection accuracy and reducing inspection time. The results demonstrate that frequency sweeping, combined with AI-driven image analysis, substantially improves defect activation compared to fixed-frequency excitation by exciting local defect resonance modes. ML algorithms enhanced signal-to-noise ratio through intelligent feature extraction and enabled prediction of defect severity. Narrowband sweeps proved most effective, providing superior thermal contrast. This study validates the synergy between sweep-based vibrothermography and artificial intelligence for reliable, automated detection of low-energy impact damage in composite materials.
Active infrared thermography (IRT) offers a non-invasive route to detect and characterise
cutaneous lesions by measuring transient surface temperature responses following controlled
cooling. This thesis presents an end-to-end investigation combining physics-based
simulation, thermogram creation, algorithmic feature extraction, machine learning and
prototype instrumentation to assess the feasibility of lesion localisation and parameter
estimation (diameter, depth, shape) from reheating sequences.
A five-layer parametric finite-element skin model based on Pennes’ bioheat equation was
developed to produce large, labelled synthetic datasets. Data pipelines converted the
generated 3D thermal data into clinically comparable 2D thermograms. Three network
architectures were evaluated — a CNN regressor (diameter/depth), a U-Net segmentation
network (localisation/area) and a 3D-CNN for spatiotemporal reheating analysis.
Experimental validation used skin-mimicking phantoms to characterise the cooling
method and the HypIRskin prototype; a multi-camera imaging platform was developed
as a scalable pathway for clinical acquisition.
Under ideal, noise-free simulation conditions deterministic methods recovered lesion
metrics with sub-millimetric error (depth ≤0.05mm; diameter/shape ≤0.1 mm). Machine learning
models trained on synthetic data achieved practical accuracies (regression: diameter
≈0.2 mm, depth ≈0.12 mm; segmentation reliable for lesions ≥1 mm). The
HypIRskin prototype produced repeatable reheating curves within an operational timeframe
(≈3 minutes per lesion). Limitations include reliance on synthetic data, limited
clinical samples and sensitivity to cooling protocol, calibration and registration.
These results indicate that active IRT preserves measurable surface signatures that reflect
underlying lesion geometry, and that physics-based simulation can reliably generate
labeled training data when clinical examples are limited. Successful translation will
require a large, carefully annotated clinical dataset to enable robust validation.
Carpal Tunnel Syndrome (CTS) is one of the most common peripheral entrapment neuropathies, resulting from compression of the median nerve within the carpal tunnel at the wrist. This condition is frequently associated with pain, reduced grip strength, and impaired fine motor control of the hand. Early diagnosis of CTS remains challenging, as conventional clinical and electrophysiological assessments often detect changes only after significant nerve dysfunction has occurred. Therefore, there is a need for sensitive, non-invasive techniques capable of identifying early functional alterations before irreversible damage develops. The abductor pollicis brevis (APB) muscle, which plays a critical role in thumb abduction and opposition, is innervated exclusively by the median nerve and is among the first muscles affected in CTS. Alterations in the thermal and mechanical properties of this muscle may reflect early neurovascular and neuromuscular disturbances associated with median nerve compromise. Infrared (IR) thermography has gained attention as a non-contact imaging modality that captures skin temperature distribution, providing indirect information about microcirculatory changes, autonomic regulation, and muscle activity. In parallel, myotonometry enables objective quantification of intrinsic muscle properties, such as dynamic stiffness, tone, and elasticity, offering insight into neuromuscular adaptations under different physiological conditions.
The present study aimed to investigate the thermal behaviour of the APB muscle in response to cold stress and to evaluate concurrent changes in myotonometric parameters in healthy individuals. Establishing normative reference data in asymptomatic subjects is an essential step toward identifying deviations associated with CTS pathology. IR thermal imaging of the palmar region was conducted on 10 healthy subjects under controlled laboratory conditions. Baseline thermal images were acquired at rest, followed by a standardized cold stress protocol involving hand immersion in water at 12°C for 5 minutes. Thermal images were recorded immediately after cold exposure to assess acute temperature changes. Myotonometric measurements of the APB muscle were obtained before and after cold stress to evaluate variations in muscle properties. Preliminary analysis revealed a significant reduction in the average temperature of the APB muscle following cold stress, consistent with vasoconstriction. Recovery patterns varied across subjects, with some showing rapid rewarming while others exhibited delayed thermal normalization. Myotonometric measurements showed increased stiffness following cold stress, suggesting a transient neuromuscular adaptation. These results underscore the APB muscle's sensitivity to both thermal and mechanical changes induced by cold stress. It is observed that IR thermography combined with myotonometry could provide a non-invasive approach to characterizing APB muscle responses. As establishing baseline characteristics in healthy individuals is crucial for early diagnosis, this study seems to be clinically useful.
Flap surgery, which is widely applied in plastic and reconstructive surgery, involves the transfer of tissue from a donor site to a recipient site while preserving its intrinsic vascular supply. This technique is particularly indicated for the reconstruction of complex anatomical structures, such as the mandible or breast, as well as for the restoration of tissue defects resulting from trauma or surgical resection when local tissue is insufficient to support grafting. In contrast to grafts, which depend on angiogenesis from the recipient bed, flaps maintain viability through their native blood supply, which may be either preserved via a vascular pedicle or re-established through microsurgical anastomosis to recipient vessels [1]. Vascular thrombosis is a severe postoperative complication that may lead to flap ischemia and subsequent tissue necrosis, ultimately resulting in partial or complete flap loss. Clinically, tissue discoloration, including progressive darkening, is a key indicator of cellular death caused by impaired perfusion. Vascular compromise not only represents a primary cause of flap failure but is also reported as the most frequent complication following flap transplantation procedures, underscoring the critical importance of early detection and timely intervention. Upon detection of vascular thrombosis, immediate surgical reexploration is essential to maximize the likelihood of free flap salvage. The success of flap rescue is strongly time-dependent, as prolonged ischemia significantly reduces tissue viability and increases the risk of irreversible necrosis. Therefore, rapid return to the operating room for restoration of blood flow is a critical determinant of clinical outcome [2]. Recent studies have demonstrated that infrared thermography enables significantly earlier detection of flap vascular compromise—often as early as 2 hours postoperatively—compared with conventional clinical examination, which typically identifies compromise no earlier than 6 hours after surgery. Early thermographic detection thus provides a valuable time window for timely intervention and improved salvage rates [3].
This study presents the use of infrared thermography for the intraoperative identification of functional perforator vessels within the transferred flap and for continuous monitoring of their perfusion status during surgery, with the aim of preventing postoperative vascular occlusion. The clinical evaluation was conducted using a FLIR A655SC thermal imaging camera operating in the long-wave infrared (LWIR) range, equipped with a 640 × 480 pixel microbolometer detector capable of detecting temperature differences below 30 mK, allowing for high-resolution, real-time assessment of flap perfusion.
[1] Fu-Chan Wei,Samir Mardini, Flaps and Reconstructive Surgery, 2nd Edition, Elsevier, ISBN 9780323243223, 2016
[2] Chen KT, Mardini S, Chuang DC, Lin CH, Cheng MH, Lin YT, Huang WC, Tsao CK, Wei FC. Timing of presentation of the first signs of vascular compromise dictates the salvage outcome of free flap transfers. Plast Reconstr Surg. 2007 Jul;120(1):187-195. doi: 10.1097/01.prs.0000264077.07779.50. PMID: 17572562.
[3] Dang J, Tan C, Pham C, Huang S, Yenikomshian H, Gillenwater TJ. Use of Infrared Thermography for Flap Monitoring: A Systematic Review. Plast Reconstr Surg Glob Open. 2021 Oct 20;9(10 Suppl):164. doi: 10.1097/01.GOX.0000799952.09908.70.
Wind turbine rotor blades are continuously exposed to harsh environmental impacts such as erosion and contamination during operation. Even small-scale surface disturbances can induce premature laminar–turbulent transition of the aerodynamic boundary layer, leading to significant performance losses. Therefore, a measurement method is needed to detect emerging local disturbances on the rotor blade surface at their earliest stage, operating contactlessly without blade modification or downtime. The goal is to identify whether the disturbance type is additive or subtractive and to estimate its position and size.
Infrared thermography (IRT) is an established flow visualization method that has been successfully applied to detect the laminar-turbulent transition on wind turbine rotor blades. Previous studies demonstrated that the disturbance-induced wake flow can be visualized and that the wake patterns are sensitive to the disturbance size and position. However, existing investigations have mainly focused on qualitative evaluation or a small set of disturbance configurations. A quantitative assessment of how wake flow patterns relate to disturbance parameters in the field of wind turbine rotor blades is missing. In particular, the feasibility of inverse estimation of disturbance parameters from thermographic wake patterns has not yet been addressed.
Therefore, wind tunnel experiments are conducted on an airfoil with a height adjustable cylindrical disturbance on its surface. Cylindrical surface disturbances are considered as a generic disturbance model to investigate how thermographic wake patterns respond to the disturbance’s position, type, diameter and height. In the present study, the influence of disturbance height is investigated as a first step toward systematic inverse estimation. The airfoil chord length is L = 60 mm and the disturbance is located at 6 mm (0.1 x/L). The disturbance diameter remains fixed (d = 3 mm), while its height is varied between h = 0.25 mm and h = 4.5 mm. IRT measurements for each height are performed at a Reynolds number of of 10⁵ and at angles of attack of 0°, 5°, and 10°.
The experimental results show that, for additive surface disturbances, the thermographically detected wake area can be quantified and the wake area increases with increasing disturbance height at a Reynolds number of 10⁵. This trend is clearly observed at angles of attack of 0° and 5°, enabling a quantitative relationship between the thermographically detectable wake area and the sought-after disturbance height. At an angle of attack of 10°, however, no consistent trend can be identified. A validation using the leave-one-out cross-validation method shows increasing height estimation errors with increasing angle of attack.
Thus, the results show the feasibility of inverse estimation of disturbance parameters based on the evaluation of thermographic wake patterns. In particular, quantitative information on additive surface disturbances is obtainable under certain aerodynamic conditions. However, a cross-sensitivity w.r.t. the angle of attack exists, which must be considered in practical applications. As a result, the present study provides a foundation for the future development of inverse modelling approaches for IRT-based indirect disturbance characterization, including investigations at higher Reynolds numbers.
Infrared thermography has emerged as a key diagnostic technique for measuring heat transfer on rotating turbine components under engine-representative conditions, where conventional techniques are often limited. In the Oxford Turbine Research Facility (OTRF), UK national engine-representative high-pressure turbine test facility, an infrared thermography methodology has been developed to enable measurements of heat transfer quantities on uncooled blade with a target velocity of 263.5 ms-1 [1].
Blade heat transfer is a performance- and life-critical aspect of high-pressure turbines, and accurate experimental measurements under engine-representative rotating remain particularly challenging. Previous studies [2] demonstrated the superiority of this infrared-based methodology, with correction of all major sources of error following the procedures developed by Sisti et al. [3], over traditional heat transfer measurement techniques such as thin-film heat flux gauges.
Previous work [1] investigated the effect of camera integration time, ranging from 20 to 1 µs, on image quality and temperature measurement accuracy, identifying motion blur as a key limitation at longer integration times. However, the contribution of blur to the overall measurement uncertainty was not explicitly quantified.
In this study, a method to account for the effect of image blur into the evaluation of temperature uncertainty is presented. The corrected target temperature image acquired at the shortest integration time test (1 µs) is taken as reference condition with negligible blur. Motion blur is modelled by applying a low-pass filter in the circumferential direction, corresponding to the direction of blur, with cut-off frequencies representative of the expected blurring at integration times of 5, 10, and 20 µs. The temperature error due to blur is obtained from the difference with the reference image and is subsequently incorporated into the post-test uncertainty analysis of surface temperature. The uncertainty builds on previously established uncertainty values for emissivity U_ε, transmissivity U_τ, and blackbody equivalent temperature U_(T_cam ), associated with the infrared calibration methodology [3]. This work represents the formal inclusion of motion blur within the uncertainty analysis of surface temperature measured with infrared thermography in the OTRF.
[1] Sisti, M., Falsetti, C., and Beard, P.F., 2025, “High speed infrared thermography to investigate heat transfer of transonic turbine rotor blades,” Measurement, https://doi.org/10.1016/j.measurement.2025.118103.
[2] Sisti, M., Adoua, R., Falsetti, C., Li, H., and Baerd, P.F., 2025, “Impact of turbine inlet temperature distortion on rotor blade heat transfer using infrared thermography and Computational Methods,” 16th European Conference on Turbomachinery Fluid dynamics & Thermodynamics, Paper No. ETC2025-318, https://doi.org/10.29008/ETC2025-318.
[3] Sisti, M., Falsetti, C., and Beard, P.F., 2024, “Infrared temperature measurements on fast moving targets: A novel calibration approach,” Measurement, https://doi.org/10.1016/j.measurement.2023.113870
INTRODUCTION
Interest in unmanned aerial vehicle (UAV) technology has been rapidly growing given its applicability across a wide range of fields, including disaster risk management, agricultural monitoring, and commercial services.
UAVs tipically employ small-scale propellers operating at low Reynolds, making them susceptible to the detrimental effects of Laminar Separation Bubbles (LSBs) during flight.
The presence of LSBs may adversely affect the flowfield around propeller airfoils, leading to potential risks during missions, such as increased noise emissions from tonal disturbances in the shear layer, premature stall and higher drag penalties.
The present work examines the flow field around a 610 mm-diameter propeller, operated at rotational speeds $\Omega = $ between 840 and 1680 RPM, corresponding to tip chord-based Reynolds numbers of $2.8\times 10^4$ and $5.6\times 10^4$.
Key features of the flowfield are reconstructed from surface temperature maps obtained via Infrared Thermography (IRT), paired with heated thin film method to extract the Stanton number $St$ distribution over the propeller.
In addition, the effects of leading edge shape modification, as a mean of passive flow control, are also investigated. The leading edge is modified by introducing a sinusoidal waviness through modulation of the local chord (tubercles). Six configurations are tested by varying two amplitude values (7 and 15 $\%$ of the local chord) and three wavelengths (10, 20 and 30 mm).
EXPERIMENTAL SETUP
The flight stand used in the experiment is the Flight Stand 15 Pro from Tyto Robotics, equipped with a Force measurement unit (FMU) for thrust (up to 8 kgf), torque (up to 8 N $\cdot$ m) and rotational speed measurements.
Propellers' blades are 3D printed in PA12 Nylon and glued together. The baseline propeller mounts a NACA 4412 airfoil and has a maximum and tip chords equal to 54 mm and 15.5 mm, respectively.
The propeller also features a variable pitch, decreasing from the root ($40 ^{\circ}$) to the tip ($12 ^{\circ}$).
In the thermal setup, the suction side of the model’s surface was radiatively heated by two 2 kW halogen lamps to enhance thermal contrast among regions where the shear stresses work differently . Thermal images are acquired in the long wave infrared range (1.5 - 5.0 $\mu$m) with a FLIR X6981-HS InSb high-speed infrared camera equipped with a 100mm lens, achieving a spatial resolution of 110 pix/$c_{max}$.
RESULTS
Thermographic analysis identify a LSB spanning through the leading edge, marked by a low-$St$ number band close to the leading edge, followed by a general increase in heat transfer, consistent with the turbulent reattachment of the LSB. At inboard stations, the flow undergoes separation shortly downstream of the reattachment of the laminar separation bubble, whereas the flow remains predominantly attached towards the tip region.
A combined assessment of performance and thermographic data of the wavy configurations highlights significant modifications in the structure and extent of the LSB compared with the baseline case.
The sinusoidal leading edge alters the $St$ distribution, by generally promoting earlier transition in the valley regions and an extension of the LSB over the peak regions.
The resulting effect on aerodynamic performance is quantified through the gain in the non-dimensional thrust-to-torque ratio $C_T/C_Q$, which is found to depend primarily on the tubercles amplitude, while the wavelength plays a secondary role.
This paper explores the use of infrared thermography to analyze body heat distribution patterns in cyclists, to evaluate its potential contribution to professional bike fitting. Seven participants completed a standardized 15-minute cycling exercise, during and after which thermographic images were captured. The goal was to detect temperature asymmetries or irregularities that may indicate discomfort, poor posture, or injuries. The thermal data revealed visible patterns, particularly in the knees, upper back, and hands, that may reflect uneven load distribution, muscular imbalance or injuries. Although promising, the study also faced limitations. Specifically, attempts to automate injury detection using the MoveNet pose estimation model were unsuccessful due to its poor performance on infrared images, as it was originally trained on RGB datasets. Given the small sample size and preliminary nature of the findings, further research with a more robust methodology is needed. Nonetheless, the study demonstrates that thermography holds potential as a non-invasive supplementary tool in cycling ergonomics and injury prevention.
Alzheimer's disease (AD) is a progressive neurological disorder marked by memory deterioration and cognitive loss, impacting millions globally. Although AD is predominantly regarded as a brain disorder, increasing evidence indicates considerable peripheral modifications, especially within the microcirculatory system. In fact, research has shown that people with AD have platelet dysfunction and altered peripheral endothelial vascular responses. Infrared thermography (IRT) has emerged as a non-invasive method for evaluating peripheral microcirculation and autonomic functions by contactless detection of skin temperature. In fact, the temporal modulation of face skin temperature, especially at responsive areas like the nose tip, has shown sensitivity to fluctuations in autonomic states modifications. In this perspective, machine learning methods, especially deep learning (DL) with transfer learning (TL), allow detecting patterns in thermal data indicative of microcirculatory abnormalities.
This work aimed to develop a classifier using transfer learning with the EfficientNet-B0 architecture to differentiate AD patients from age-matched healthy controls (HC) using IRT spectrograms obtained from resting-state nose tip temperature measurements.
The study sample was composed of 12 AD patients (average age 71.6 ± 4.6 years; 7 men and 5 women) with moderate AD (according to DSM-5 criteria, MMSE > 20/30) and 15 HC (average age 69.3 ± 5.8 years; 10 men and 5 women). A FLIR SC660 camera (640×480 pixels, <30 mK sensitivity, 10 Hz sampling) was used to take thermal images of participants while they were resting for 5 minutes in a controlled setting (22-24°C, 45-50% humidity). The camera was 60 cm away from the individuals. After 15 minutes of acclimation, participants sat with their eyes closed while their face temperature was acquired. The nose tip was automatically tracked across frames, delivering a continuous temperature time series. Spectrograms of the nose tip temperature oscillations were computed and used as input of TL based on the EfficientNet-B0 model. To save learnt general features, the convolutional layers were frozen, while the last classification layer was modified to a binary classifier (AD vs. HC). Data augmentation based on random horizontal flipping, rotating by 15°, and color jittering was implemented. A 5-fold stratified cross-validation was used to partition the sample such that the classes were balanced. The Adam optimizer (learning rate: 10-4) was used for training, with cross-entropy loss for 10 epochs per fold (batch size: 8).
The EfficientNet-B0 model reached an overall accuracy of 78.7% across all folds, with a sensitivity of 86.7% and a specificity of 70.6%.
The findings indicate that time-frequency representations of spontaneous thermal oscillations recorded on the nose tip provide discriminative information for AD identification through DL methodologies. These results foster the employment of IRT combined with DL for the development of a screening method that is non-invasive, contactless, and comparatively cost-effective for clinical applications.
Introduction During the COVID-19 pandemic, infrared thermography (IRT) was widely used to estimate deep body temperature for workplace screening. However, we previously highlighted major limitations of predicting core temperature from skin temperature (Mekjavic & Tipton, 2020), demonstrating substantial elevations in skin temperature during moderate work in 40 °C conditions with minimal changes in rectal or aural temperature—leading to false-positive fever assessments. We reasoned that such errors would be amplified during summer heatwaves in industries relying on IRT screening. Therefore, we evaluated: (i) the correlation between skin temperature measured by IRT and by contact thermistors, and (ii) the ability of IRT to predict core temperature.
Methods Quantitative Infrared Thermography (QIRT) was used to monitor skin temperature responses to a three-day simulated heatwave during which participants conducted light work (stepping test). The responses during the heat wave were compared with the responses observed during three-day normothermic periods before and immediately after the 3-day heat wave. Five health young females (age: 24 ± 2.2 y; weight: 72 ± 13.4 kg; height:162 ± 7.2 cm) participated in the study. They were confined to the facility for the duration of the 9-d study. The day/night temperature during the normothermic conditions was 25°C(day)/22°C (night), and during the heat wave days 35°C(day)/26°C (night). Skin temperature at the forehead, fingertip and forearm was estimated using a FLIR E96 infrared camera (640 × 480 pixels) and simultaneously with contact thermistors (TSK) (iButtons). Gastrointestinal temperature (Tgi) was measured with a radio pill (Body Cap,Caen, France). Finger blood flow was derived from the proximal (forearm, Tforearm) and distal (fingertip, Tfinger) skin temperature gradient (∆Tfinger-forearm). Daily measurements were made before and after the light work sessions during both normal temperature and heatwave days. Five timepoints were used for analysis: 8:40, 10:00, 10:40, 16:00 and 16:40. Thermal data were processed in FLIR Thermal Studio and analysed using Excel and GraphPad Prism. Results were evaluated using two-way ANOVA and, given the low sample size, complemented with effect size analysis (Hedges’ g).
Results There was positive correlation between IRT and TSK (r = 0.56, p < 0.001), but a negative weak correlation between IRT forehead temperature and Tgi (r = - 0.24, p = 0.001). Distal blood flow (∆Tfinger-forearm) during the heatwave, determined with IRT and TSK, was elevated at all timepoints (mean G = 1.05). The work-induced elevation in peripheral skin blood flow (∆Tfinger-forearm) and consequently skin temperature, was greater in the heatwave than in the normothermic condition, whether derived with IRT (G = 0.70) or TSK (G = 2.28). There was no correlation between skin temperature derived with either IRT or TSK and Tgi.
Conclusion High-quality IRT correlates with skin thermistor data, however, it cannot be used to predict core temperature.
The usage of infrared thermal imaging (IRT) for breast cancer (BC) diagnosis has been its first medical application, but its feasibility is still a debatable question. It is aim of this research study conducted in a cancer hospital to relate the thermal findings with the information retrieved from other medical imaging modalities. In a study involving 29 already diagnosed with other imaging modalities BC patients, it was found that there is no relationship between the thermal variables and location (ρ=0.2), size and cancer stage (p>0.05). Conclusion supports that static IRT is not adequate for BC identification. However, further research is required to prove the adequacy of dynamic IRT and usage of intelligent analysis methods.
Introduction: Chronic itch is a clinically significant condition for which effective treatments remain limited. Experimentally induced itch using histamine and cowhage provide a controlled and reproducible way to study the mechanisms of itch, helping identify and test new therapeutic targets. However, histamine and cowhage differ in several characteristics, including their ability to elicit secondary neurogenic flares (vascular changes of the skin). This study aimed to compare three different methodologies used to assess neurogenic flare: Laser speckle contrast imaging (FLPI-2), optical coherence tomography angiography (OCTA), and infrared-thermography (IR), and to study if they could differentiate between histamine and cowhage induced neurogenic flare.
Methods: Four 4x4cm areas on the forearms of 9 participants were selected. Two areas were treated with histamine or cowhage application for 10 and 5 minutes respectively, while two other areas were used as controls. The blood perfusion and temperature were assessed using FLPI-2, OCTA, and IR-thermography before and after histamine or cowhage application. The mean superficial blood perfusion (SBP) was extracted from the FLPI data, the mean temperature was extracted from the IR data, while the Vessel Area Density (VAD) was extracted from the OCTA data.
Results: All three methodologies showed a significant difference in flare from baseline (BL) to post-treatment (PT) measurements for histamine (OCTA, Thermography, FLPI-2: p<0.0001). Meanwhile no significant change from BL to PT was seen for cowhage (OCTA: p=0.26; Thermography: p=0.88; FLPI-2: p=0.54). One-way ANOVA indicated a significant difference between cowhage and histamine at PT (OCTA: p=0.0024; IR: p<0.0001; FLPI-2: p<0.001) and a paired t-test showed that histamine caused a larger flare than cowhage (OCTA: 95% CI [8.13-21.07%], p=0.0008; IR: 95% CI [1.49-2.60 °C], p<0.0001; FLPI-2: 95% CI [91.20-180.73 A.U.] p<0.001). No baseline differences were observed between cowhage and histamine (OCTA: 95% CI [-7.43-2.78%], p=0.3242; IR: 95% CI [-0.12-0.44 °C], p=0.2292; FLPI-2: 95% CI [-15.20-15.20 A.U.], p=1.0).
Conclusions: This pilot study demonstrates that all three methodologies were able to detect histamine-induced neurogenic flare, showing a significant increase from baseline to post-treatment measurements. None of the methods detected a flare response to cowhage. These findings support the potential clinical use of OCTA, IR thermography and FLPI-2 for assessing vascular changes associated with itch-related conditions. Each technique assesses distinct aspects of neurogenic flare, which can provide insight into underlying differences of peripheral pathological mechanisms and how pharmaceutical treatment act in different layers of the skin. Hence, the presentation will explore how the techniques can differentiate neurogenic flares.
Monitoring native plants is essential for environmental conservation, yet many traditional methods lack sufficient accuracy for interspecific discrimination. This work investigates plant optical properties across the short-, mid-, and long-wave infrared (0.88–15 µm) and proposes a high-precision, non-destructive remote monitoring approach based on hyperspectral infrared radiometry. In the LWIR, where thermal emission dominates under atmospheric conditions, variations in chemical composition—such as cellulose, xylan, and terpenes—directly affect spectral emissivity, producing species-specific emission signatures. Although LWIR radiometry remains underexplored due to high instrumentation costs and background noise complexity, it enables chemically driven discrimination that is less influenced by pigmentation and morphology than SWIR-based methods. High-resolution spectral emissivity data will be organized into a reference database and analyzed using a Python routine to enable robust multispectral classification. The proposed approach offers improved predictive accuracy and a viable alternative for remote monitoring of native species.
Innovative Shape Memory Polymer investigated by IRT and DIC during loading process
by E.A. Pieczyska, M. Staszczak, M. Maj, S. Musiał, K. Takeda, M. Cristea and A.D. Lantada**
Institute of Fundamental Technological Research PAS, Warsaw, Poland
* Aichi Institute of Technology, Toyota-city, Japan
** Institute of Macromolecular Chemistry, "Petru Poni" Iassy, Romania
*** Universidad Politécnica de Madrid (UPM), Madrid, Spain
Shape memory polymers (SMPs) are stimuli-responsive multifunctional materials that can change their shape in a predefined manner under an applied external stimulus, e.g. temperature change. The mechanism is related to the fact that the elastic modulus changes dramatically at the temperatures above and below their glass transition temperature Tg - it is high at low and low at high temperature [1]. Particularly noteworthy is a new generation of multiple-shape memory polymers (mSMPs) that demonstrate the ability to memorize more than two various shapes. The goal is to design and investigate the shape memory micro-actuators (M-As) with triple or quadruple shape memory properties. The M-As are produced by additive and micromanufacturing technologies towards obtaining a product component with different polymerization degrees. To this end, different exposure times of different regions of the tested photopolymer are used. The actuation to trigger the shape change of 4D printed mSMPs is step-by-step heating to various temperatures. Such approach can extend the performance of 4D printed structures and facilitate the design and development of devices featuring intricate structures unattainable through traditional techniques. In this way their functionality is broadened, enabling miniaturization, crucial for robotic and biomedical applications.
The research concerns two SMPs - thermoplastic polyurethane shape memory polymer (PU-SMP) and thermoset photopolymer - shape memory epoxy (SMEp). Investigations addressed both polymer structure and mechanical/thermomechanical behavior—from elastic loading through plastic deformation, localization, to necking and damage—with Infrared Thermography (IRT) applied for the latter [2].
Measurement of the SMPs temperature field during the loading is performed using a fast and sensitive infrared camera FLIR A6753. The field evolution of the heat sources associated with the deformation process at various stages of the loading/deformation is determined experimentally. The displacement fields are measured by Digital Image Correlation (DIC) using the homemade algorithm implemented in the ThermoCorr software [2]. The developed method applied is based on the coupled displacement and temperature fields measured using the DIC and (IRT), incorporating principles of heat transfer theory [3].
REFERENCES
[1] Tobushi H., Matsui R., Takeda K., Pieczyska E.A., Mechanical Properties of Shape Memory Materials. Nova Science Publishers, New York, 2013
[2] Golasiński K., Maj M., Urbański L., Staszczak M., Gradys A. ,Pieczyska E., Experimental study of thermomechanical behaviour of Gum Metal during cyclic tensile loadings: the quantitative contribution of IRT and DIC, Quant Infrared Thermogr J., 1-18, 2023
[3] Musiał S., Maj M., Urbański L., Nowak M., Field analysis of energy conversion during plastic deformation of polycrystalline material, Int. J. Solids Struct., 238, 111411, 2022
Acknowledgments:
The research has been carried out with support of the Polish National Center of Science under Grant UMO-2024/53/B/ST8/03931
The use of remotely piloted aircraft systems (RPAS) – drones – over the past decade has led to a massive increase in both data acquisition and applications for thermal systems. The thermal sensors in many RPAS are of sufficient quality that quantitative information can be extracted with some measure of confidence. In this work we present quantitative results of a 6-year thermographic imaging study of district heating systems (DHS) in Canada at Canadian Forces Bases – Gagetown, Kingston, Petawawa, Cold Lake, Comox and Bagotville. In general, DHS are linear thermal sources that are up to 10’s of km’s in length. As it is the primary heating infrastructure of large-scale campuses, DHS also radiate a significant amount of energy as heat in-between buildings which becomes lost to the environment. The in-between building’s portion of the DHS is the focus of this study. Our methodology relies on acquiring not only RPAS thermographic imagery, but also supporting ground data during the time of the RPAS data collection as well as ensuring the reliability and validation of the thermal sensor. With considerations of various emissive materials over the DHS (soil, asphalt, gravel, concrete, etc) and environmental conditions (air temperature, ground temperature, humidity, wind speed, etc) we processed the thermographic RPAS imagery to provide a quantifiable energy loss value for the entire DHS within a georeferenced system.
The thermal output results from individual heat loss sections within the DHS studied vary from ~ 100 W/m to over 500 W/m with the average energy loss over the 6 sites being 189.4 W/m with a standard deviation of 23.9 W/m and a standard error of the mean of 9.75 W/m. In-situ validation of the RPAS thermographic results were obtained by a 3rd party using traditional heating system heat loss measurements and agree to within 7%. As the entire length of each DHS is known well, we are able to estimate the entire energy loss. The total annual energy loss of all 6 locations amounts to 327.5TJ, which is equivalent to the entire energy budget of ~ 3700 average Canadian homes.
Modern structural engineering increasingly relies on lightweight, high-performance materials. To minimize mass, the use of excessive safety factors is no longer viable, and designs are pushed closer to their operational limits. This necessitates reliable Non-Destructive Testing (NDT) to maintain operational standards. One of the challenges in this domain is the detection of Barely Visible Impact Damage (BVID) in composite structures. BVID is often characterized by a complex morphology that combines subsurface delaminations with surface-breaking cracks.
This work addresses these challenges by developing a comprehensive framework for active Laser Spot Thermography (LST). While LST allows for precise inspections, its defect detection capability depends on the specific excitation parameters. This study proposes a quantitative, numerical simulations-based framework for the selection of the inspection parameters for LST. The framework comprises three different stages.
First, for materials with unknown thermal properties, local thermal diffusivity is experimentally estimated via initial LST measurements. Using known density and specific heat capacity values, the diffusivity is converted into thermal conductivity to define the material properties in the numerical model.
Second, the workflow utilizes a Finite Element Method (FEM) environment where the sample geometry is fully parameterized. It performs 3D thermal simulations under a stationary Gaussian-shaped heat source across a grid of excitation points, mirroring the experimental procedure. This environment determines the effective inspection parameters: laser power, heating time, cooling time, and the spatial scanning step. The selection algorithm balances three constraints: maintaining the surface temperature below a user-defined safety threshold, achieving a required Signal-to-Noise Ratio (SNR), and determining the largest acceptable scanning step. The algorithm iteratively reduces the scanning step size until the specific SNR target is met, thereby minimizing the total inspection duration.
Finally, in the third stage, the determined parameters are applied to the inspection. To ensure consistent defect quantification, the framework employs a unified signal processing pipeline that incorporates Thermal Signal Reconstruction (TSR) and spatial gradient analysis, applied identically to both synthetic and experimental datasets.
The accuracy of the simulation results was validated against experimental data from Carbon Fiber Reinforced Polymers (CFRP) with Flat-Bottom Holes (FBH) and aluminum plates with artificial notches. The comparative analysis demonstrated that the simulation provides conservative SNR estimates (typically underpredicted by approx. 15%) to ensure reliable detection. Subsequently, the methodology was applied to case studies involving a steel sample with artificial cracks and a CFRP sample with BVID damage, where it successfully resolved both the surface cracks and the underlying delamination.
The obtained results indicate that numerical modeling effectively supports NDT planning and is a valuable complement to experimental testing that facilitates precise material characterization and effective detection of defects.
Compared with conventional optical excitation thermography techniques, such as pulsed thermography (PT), lock-in thermography (LIT), step-pulse thermography (SPT) and linear-chirp thermography, chirped-pulse thermal-wave radar thermography has been demonstrated to provide a higher signal-to-noise ratio (SNR) and more effective depth-profiling capability. This enhanced performance originates from the use of short chirped pulses, which maintain a nearly flat power spectrum over a broad bandwidth, even in the presence of diffusive attenuation. However, conventional laser-based signal-modulated heating schemes require both spatial and temporal modulation – typically generating a rectangular heating area via projection or lensing, followed by digital waveform modulation. This leads to localized heating areas and prolonged heating durations, which significantly limit their applicability in practical industrial inspections. In addition, industrial samples, such as cast components, often exhibit large-scale and complex geometries. To perform infrared thermography on such samples, they must typically be divided into multiple sub-areas for sequential heating and recording, introducing pronounced boundary effects and complex data concatenation issue. In this work, we propose a spatially modulated heating strategy combined with a robotic arm moving at a constant speed. In details, the heating source consists of multiple linear heating strips arranged with different spatial intervals, while the heat source and infrared camera remain fixed. The robotic arm moves the sample at a constant speed across the heating and recording area. Using a dynamic-to-static reconstruction algorithm, the chirped-pulse thermal-wave radar signal can be generated for each pixel. This approach enables continuous chirp-pulse thermal-wave radar thermography by replacing temporal modulation with spatial modulation, thereby not only simplifying the system and reducing overall cost but also allowing for uniform heating of large and complex samples. Experiments and simulations are conducted to optimize key parameter, and various image processing algorithms - including principal component thermography (PCT), pulsed phase thermography (PPT), and partial least square regression (PLSR) - are applied to further enhance detectability. Image quality is quantitatively evaluated using signal-to-noise ratio metrics. The results demonstrate that this method holds strong potential for real-world industrial inspection applications. Moreover, the strategy of replacing temporal modulation with spatial modulation is expected to be extended to other emerging applications, such as random-coded and adaptive thermography, broadening its versatility in non-destructive testing.
Non-invasive and portable approaches are fundamental for the analysis of cultural heritage, especially in the case of extremely fragile items. This is particularly true for Herculaneum papyri, which represent one of the most extraordinary archaeological discoveries of all times, being the only library directly survived from antiquity and providing insights into ancient book production, Greek philosophy and classical literature. These precious manuscripts survived from the eruption of Mount Vesuvius in 79 AD thank to the carbonisation process that occurred in Herculaneum. After their discovery in 1751, most of the scrolls were mechanically unrolled using a specifically designed machine. This system allowed the rolls to be opened but produced fragments with complex multilayered morphologies with texts buried within the layers. Moreover, owing to carbonisation, the papyrus substrate has darkened or blackened, making it difficult or impossible to read the text, which is also written in black, with the naked eye. Therefore, it is mandatory the use of specific non-invasive techniques for enhancing textual legibility. Studies on the recovery of texts in ancient manuscripts show that techniques such as NIR reflectography (NIRR) or hyperspectral imaging (HSI) achieve best results in terms of the overall readability but show also limitations in terms of identifying hidden details (NIRR) and image definition (HSI). This contribution presents the application of Pulsed Thermography (PT) for the analysis of these peculiar objects with the following goals: (i) readability enhancement of the text on the superficial layer; (ii) identification of textual elements buried among multiple layers; (iii) characterisation of the papyrus substrate. PT is a non-invasive photo-thermal technique that consists of recording the infrared (IR) radiation emitted by the sample following the heating induced by the absorption of short pulses of visible (VIS) light emitted by flash lamps. In the case of optically semi-transparent materials, such as the papyri under investigation, two mechanisms can be identified for the contrast generation of thermal images. On one hand, when the VIS light reaches the papyrus surface, the inked parts are instantaneously heated by the light absorption to a greater extent in comparison with the papyrus substrate, thus resulting in a corresponding larger local IR emission. In this case, the highest contrast between the text and the substrate is achieved just after the light pulse. On the other, if text is buried inside multiple layers and if a portion of excitation VIS light reaches the text, the latter is heated but its consequent direct IR emission is totally absorbed by the carbonized layers above the text. An IR contrast can be then detected by the camera at certain time delay from the light pulse, when the heat generated in the buried text reaches the sample surface because of its diffusion. These mechanisms allowed the inspection of both surface textual features and the complex stratigraphy of unrolled Herculaneum papyri. The experimental setup for these analyses consisted in two flashes for the light stimulation and a thermal camera for data acquisition (MWIR spectral range 3.5–5 μm, FPA 640 × 512 pixels). A close-up ring was also used for closer inspections when the sample was difficult to handle during the measurements.
Visual inspection is traditionally used for the detection of surface cracks in aircraft structures, but its reliability strongly depends on inspector expertise and remains time-consuming. To overcome these limitations, alternative non-destructive testing (NDT) methods are required to ensure reliable crack detection during production and maintenance operations. Among infrared thermography techniques, laser-based flying spot thermography has demonstrated strong potential for detecting open surface cracks in metallic structures. This method consists of scanning a specimen with a localized laser heat source while monitoring the thermal response using an infrared camera. When the heat source approaches a crack, a local thermal discontinuity appears due to the disturbance of heat diffusion, revealing the presence of an open crack.
At ONERA, a multispectral inspection bench has been developed to detect and characterize surface cracks on metallic specimens by combining visible and infrared imaging. Visible (RGB) images are first used to identify potential crack-like features, while flying spot thermography is then applied to discriminate actual cracks from surface-related artefacts such as machining marks or surface stripes. In this context, improving crack detectability while minimizing inspection time remains a key challenge.
This work proposes an optimized flying spot thermographic inspection strategy based on a single-pass, parallel laser scan along the crack direction, which is more compatible with operational maintenance constraints than conventional back-and-forth scanning approaches. While this strategy significantly reduces inspection time, it is more sensitive to surface conditions, particularly surface roughness. To address this limitation, a three-dimensional finite element thermal model based on heat conduction and advection–diffusion equations is developed to simulate laser thermography inspections under varying surface roughness conditions. This numerical model enables the analysis of thermal artefacts induced by surface roughness, which can attenuate or mask the thermal signature of cracks.
Based on the numerical results, a dedicated signal processing strategy is developed to mitigate roughness-induced structural noise, particularly when high-pass filtering is applied, which tends to amplify surface-related artefacts alongside crack signatures. The proposed processing approach is first validated on simulated data and subsequently applied to experimental measurements.
Following the numerical study, a multispectral experimental campaign is conducted on metallic tensile specimens exhibiting different surface roughness levels. Two optical configurations are used: a standard 25 mm objective and a high-magnification optical microscope providing a spatial resolution down to 15 µm. While the highest spatial resolution enables the detection of very narrow cracks with widths below 10 µm, it also significantly amplifies surface-structure noise. The combined numerical and experimental results demonstrate the relevance of the proposed multi-scale inspection and processing strategy for reliable crack detection and provide practical guidelines for optimizing flying spot thermographic inspection parameters in aerospace maintenance applications.
Carbonation in reinforced concrete (RC) is a physicochemical process that progressively reduce pore solution alkalinity and create conditions conducive to reinforcement depassivation and corrosion. Several non-destructive testing (NDT) methods, including ultrasonic and electrical techniques, have been investigated for carbonation detection. However, current practice primarily relies on invasive procedures, such as core extraction and phenolphthalein indicator testing. The use of infrared thermography (IRT) for carbonation assessment remains insufficiently investigated and lacks comprehensive validation. This study evaluates the feasibility of infrared thermography as a non-contact, non-destructive method for detecting carbonation in concrete. The working hypothesis is that carbonation alters the near-surface thermal properties of concrete, resulting in surface temperature contrasts (ΔT) detectable under controlled thermal excitation. These contrasts are expected to exceed the noise-equivalent temperature difference (NETD) of the infrared cameras and be statistically distinguishable from those in non-carbonated specimens. Concrete specimens with water/cement ratios of 0.45, 0.50, and 0.60 were cast and exposed to accelerated carbonation under controlled laboratory conditions for periods ranging from 14 to 35 days. The results were systematically compared with those obtained from non-carbonated reference specimens. Moreover, electrical resistivity testing was performed concurrently to provide complementary data on microstructural changes induced by carbonation. Phenolphthalein testing was used as the reference method for the validation of the results. The preliminary results indicate statistically significant differences in thermal response between carbonated and non-carbonated specimens under identical thermal loading. Complementary electrical resistivity measurements provide additional evidence of differences between carbonated and non-carbonated concrete.
The size-of-source effect (SSE) is among the largest contributors to measurement uncertainty in thermography. It describes a systematic deviation of the measured temperature of an object with respect to its size and results from a variety of effects, such as diffraction, detector discretization, aberrations, and scattering. According to theory, the SSE can be explained by the modulation transfer function (MTF), which describes the camera's system response in the spatial frequency domain. In practice, MTF measurements are commonly performed using the slanted edge method, which primarily captures the effects of diffraction and discretization in the vicinity of the slanted edge. In this case, broad scattering contributions are largely neglected, limiting the MTF's ability to fully describe the SSE.
This work addresses this limitation by modeling the SSE using a measured MTF complemented by a parametric scattering model.
To achieve this, a long-wave infrared (LWIR) camera equipped with a wide-angle optical lens was studied experimentally. The MTF and SSE were measured using a blackbody radiator with a slanted-edge target for the MTF measurement and two adjustable iris apertures for the SSE measurement to realize different target sizes. In the following, the system MTF
\begin{equation}
{MTF_\mathrm{sys}}({f}{\mathrm{x}})=MTF\mathrm{meas}({f}{\mathrm{x}})\cdot STF({f}{\mathrm{x}})
\end{equation}
is defined as the product of the measured MTF $MTF_\mathrm{meas}$ and a parametric ("scattering") transfer function
\begin{equation}
STF({f}{\mathrm{x}}) = A + B \cdot \exp{\left(-\pi{\left(C\cdot{f}{\mathrm{x}}\right)}^{2}\right)}
\end{equation}
with
\begin{equation}
A = 1-B,
\end{equation}
the model parameters $B$ and $C$ and the spatial frequency ${f}_{\mathrm{x}}$. The STF aims to approximate the scattering-based spatial frequency response neglected by the measured MTF and is strongly motivated by the Harvey-Shack surface scatter theory. The shape of the STF is based on the assumption that a small fraction $B$ of the radiation is scattered along its path, resulting in a Gaussian scattering pattern whose width is proportional to the parameter $C$.
In order to model the SSE, the camera is considered a black box receiving ideal rectangular input signals
\begin{equation}
{I}{d}(x) =
\begin{cases}
{L}{\mathrm{ref}} & \text{if } |x|\leq\frac{d}{2}\
{L}{\mathrm{bg}} & \text{if } |x|>\frac{d}{2}
\end{cases}
\end{equation}
of width $d$ and pixel coordinate $x$ along the horizontal detector axis, each representing a one dimensional slice of different-sized circular objects at constant radiance ${L}_{\mathrm{ref}}$ and background radiance ${L}_{\mathrm{bg}}$, where ${L}_{\mathrm{ref}}$ is introduced as an additional model parameter and ${L}_{\mathrm{bg}}$ is known. The ideal input signals are convolved with the inverse Fourier transform $\mathcal{F}^{-1}$ of the system MTF, producing the modeled output signals
\begin{equation}
{O}{d}(x)={I}{d}(x) \ast \mathcal{F}^{-1}\big{{MTF\mathrm{sys}}\big}
\end{equation}
in which the modeled SSE is evaluated for a given set of target diameters. The model parameters ${L}_{\mathrm{ref}}$, $B$ and $C$ are determined by minimizing a cost function between the modeled and the measured SSE.
The results show that the proposed model significantly improves the description of the SSE within a linear systems framework, particularly for large measurement objects, where the object's center is located far from the edges. In this case, the effects of diffraction and discretization are negligible with respect to the SSE, while the effect of scattering is more significant. The proposed model may provide a basis for SSE correction through the application of parametric compensation approaches, with parameters informed by physical knowledge.
The continuous improvement of aero-engines, driven by industrial and environmental motivations, implies an ever-increasing level of thermal and mechanical stresses within the turbines. structural materials (titanium, nickels-based superalloys, TBCs, etc.) are stressed to their performance limits and altered by environmental degradation mechanisms involving changes in surface and subsurface properties [1]. A better understanding of these damages and their initiation requires the development of characterization methods capable of microscopic, in-situ, and continuous monitoring of thermochemical-mechanical mechanisms, such as oxidation-assisted failure. Non-contact imagery techniques, such as digital image correlation (DIC) and infrared (IR) thermography, offer promising solutions for the in-situ and non-intrusive monitoring of these dynamic scenes. Experimentally, determining thermo-optical properties is complex, particularly for heterogeneous, dynamic surfaces composed of multiple materials—typical of oxidation processes—as it depends on variables factors such as material composition (metal, oxide, intermetallic…), microstructures, surface roughness, temperature, and wavelength.
Although originally intended for mapping temperature, some IR thermography methods are promising candidates for the spatial and temporal determination of the surface’s thermo-optical properties. Particularly, near-infrared (NIR) thermography techniques (0.7-2.5 µm spectral range) can exploit the semi-transparent properties of oxides and are also compatible with temperature determination in most high-temperature processes where oxidation occurs, ranging from 600 °C up to more than 1100 °C. Based on preliminary research [2, 3], thermoreflectometry emerges as a technique capable of in-situ and full-field monitoring of the reflectivity on heterogeneous and dynamic surface. The technique is based on two multi-spectral measures of both bidirectional reflectivity and radiance temperature, allowing the resolution of a radiometric system of equations for the determination of the emissivity and the true temperature. Such analysis unveils the potential to map the optical signature—through emissivity/reflectivity determination—enabling the simultaneous identification and spatial localization of oxidation products. Consequently, offering the perspective of monitoring local kinetics of oxidation reactions, as well as the evaluation of surface temperature.
This work details the thermoreflectometry method and describes the design of the micro-thermoreflectometer capable of performing thermo-optical measurements in the NIR spectral band with sub-micron spatial resolution (0.625 µm.pixel-1) up to 1000 °C. A particular attention given to its calibration on Spectralon® white, diffuse Lambertian standards. Validation of the method is then proposed, first on diffuse gray-level samples and subsequently on a real oxidized surface, with particular emphasis placed on the quantitative optical identification of oxides coupled with spatially resolved detection. The suggested device demonstrates the feasibility of detecting and correlating thermo-optical properties with microstructural and oxidation evolution at the surface and subsurface through a spectral signature. The proposed signature—based on the analysis of the resulting system’s output from an innovative framework—allows to identify and quantify oxidation damages at the surface from their thermo-optical response.
[1] Young, D. J., 2016. High Temperature Oxidation and Corrosion of Metals Ed. 2 978-0-08-100101-1, (2016), https://doi.org/10.1016/C2014-0-00259-6
[2] Javaudin, B., Gilblas, R., Sentenac, T., Le Maoult, Y., Experimental validation of the diffusion function model for accuracy-enhanced thermoreflectometry, Quantitative InfraRed Thermography Journal, vol. 18 (1): 18—33, (2021), https://doi.org/10.1080/17686733.2019.1665297
[3] Lafargue-Tallet, T., Vaucelle, R., Caliot, C. et al. Active thermo-reflectometry for absolute temperature measurement by infrared thermography on specular materials. Sci Rep 12, 7814, (2022), https://doi.org/10.1038/s41598-022-11616-8
Early detection of fatigue damage in metallic structures and complex components is limited by slow and often destructive procedures based on S–N curves, crack monitoring, and post-failure crack analysis. Infrared thermography (IRT) has recently been employed to identify ``invisible'' fatigue damage in thermosetting epoxy resins through a thermodynamic indicator based on entropy generation. This approach enabled non-destructive, full-field quantification of fatigue damage long before the onset of visible cracking. In that framework, equivalence is imposed between mechanically generated entropy, derived from cyclic stress--strain hysteresis, and thermal entropy, obtained from thermophysical properties measured by lock-in thermography. The present joint research investigates whether the same entropic damage indicator can be extended to structural metallic materials.
Fatigue tests are conducted on metallic specimens with notched geometries under controlled cyclic loading. In order to probe different fatigue regimes and damage mechanisms, specimens are intentionally loaded both below and above the fatigue limit. A key motivation comes from thermographic fatigue studies on steels showing that dissipative mechanisms change across the fatigue limit: anelastic dissipation is dominant below the endurance limit, whereas microplasticity and dislocation activity increasingly govern dissipation above it.
Based on previous studies, mechanical entropy generation was assumed to have the same value as thermal entropy generation.
Mechanical entropy was evaluated from the stress–strain response and thermal entropy was independently measured by means of lock-in thermography in vacuum conditions to minimise convective losses and improve repeatability. Measurements are acquired on specimens in the as-received state and after prescribed fatigue exposures. From amplitude and phase response, spatially resolved thermophysical properties (effective thermal diffusivity, thermal conductivity and volumetric heat capacity) are extracted, allowing computation of local thermal entropy generation. The temperature dependence of the specific heat capacity is described by a dedicated relationship formulated on the basis of the Debye model and the density is determined according to the Archimedes principle. The resulting entropy fields are then compared with conventional fatigue indicator in order to validate the applicability and sensitivity of the entropic metric to metallic materials.
To complement the entropic indicator, also a modified Two-Curve Method (TCM) is applied to the thermographic self-heating data to identify the transition between below-limit anelastic dissipation and above-limit microplasticity-dominated dissipation. Different thermal–stress relationships have been proposed in the literature to capture these two regimes and their transition. Below-limit conditions target run-out/high-cycle regimes where damage is subtle and distributed; above-limit conditions accelerate damage accumulation and promote early crack initiation and crack-tip dissipation.
The endurance limit is then obtained as the intersection of the two fitted regimes.
The overall aim is to assess whether the methodology can be generalised and thermography can be regarded as a suitable non-destructive technique for early detection and quantitative assessment of fatigue damage in metallic structures relevant to mechanical and aerospace engineering.
Temperature represents a key characteristic in additive manufacturing (AM) processes for metals. As a physical quantity, temperature provides a direct measure of the actual process state and can be an indicator for the process quality. Consequently, process evaluation based on temperature measurements, rather than solely on the monitoring of process radiation in gray values, is expected to offer increased robustness and explanatory power. However, dependable quantitative in-situ temperature measurements remain highly challenging due to extreme temperature gradients, emissivity changes and, in case of the widely used process laser powder bed fusion of metals (PBF-LB/M), due to the required high spatial and temporal resolution. To nevertheless obtain reliable temperature measurements, besides other factors, a robust thermal calibration of the measurement system is fundamental.
The de facto standard for the thermal calibration of thermal camera systems is the use of black-body radiators, as set out in several technical norms and standards (among others: ASTM E1933, IEC 62942, VDI 5585, VDI 3511). However, especially in the visible and near-infrared (VIS-NIR) range, this is not always feasible in practical applications. Apart from the high costs of calibrated blackbody radiators, their calibration is usually not valid in this wavelength range and significant deviation to black body radiation occurs. Furthermore, their physical size usually prohibits use within a PBF-LB/M build chamber, so it is not possible to calibrate the entire optical path with this type of calibration source. This limitation is exacerbated by machine- and system-specific optical interfaces (e.g., protective windows and viewports) that must be traversed in operation and can alter transmission and spectral response. In-situ solutions are therefore recommended, as these enable calibration of the complete on-machine optical path.
In this contribution, three different proof-of-concept approaches for the thermal calibration of monitoring systems for the PBF-LB/M process are presented and compared: 1) Calibration using blackbody-like radiation sources - For this purpose, the suitability of the pipetting hole of the graphite tube of a graphite furnace atomic absorption device and a graphite cylinder heated by the PBF-LB/M process laser with a suitable borehole are examined. 2) Calibration using a calibrated halogen light source and an isotopic (Ulbricht) sphere with a known color temperature – as special case for the VIS/NIR range and 3) the single-point calibration at the solidification plateau of molten metal samples – the melting also takes place within the PBF-LB/M process chamber using the process laser. While, as described, some of the approaches presented here are ex-situ, others can be carried out in situ in the PBF-LB/M process chamber, allowing the calibration of the complete optical path. As a ground-truth, additional measurements at a calibrated blackbody radiator were performed.
The calibration approaches are tested using a Multispectral Optical Tomography (MS-OT) sensor system. MS-OT operates in the VIS-NIR range and constitutes an approach for determining apparent maximum surface temperatures Tmax during the PBF-LB/M process.
This article addresses the need for dense and spatially coherent three-dimensional thermal information in short-range thermal digitization processes, where small- and medium-sized objects require an accurate representation of both their geometry and thermal distribution. Conventional two-dimensional thermography techniques, although widely used for object inspection and thermal analysis, provide only a partial view of thermal phenomena due to the lack of complete geometric information and three-dimensional spatial referencing. In this context, 3D thermal point clouds emerge as a suitable solution for the unified integration of geometric and thermal information, enabling a more complete and accurate characterization of digitized objects in controlled environments.
This work presents a system capable of generating dense 3D thermal point clouds as a preliminary step toward the creation of complete thermal models. The system is based on the fusion of three imaging sensors: two RGB cameras and one thermal camera, all integrated into a portable and easily deployable setup. The combination of visible and thermal cameras allows the high geometric resolution provided by RGB imagery to be associated with the thermal information captured by the infrared camera, resulting in an enriched three-dimensional representation. The system design is oriented toward medium-scale environments, both indoor and outdoor, while maintaining a balance between portability, accuracy, and acquisition capability.
The article describes in detail the proposed methodology for generating the thermal point cloud, with particular emphasis on the calibration process between the different sensors. Accurate calibration is a critical aspect of such systems, as small errors in geometric or thermal alignment can lead to significant inconsistencies in the final model. The proposed approach incorporates an automatic calibration method that introduces novel elements with respect to previously published works, improving the accuracy, robustness, and repeatability of the system while reducing dependence on manual procedures or environment-specific configurations.
One of the main contributions of the system is its ability to generate thermal point clouds in real time. This capability significantly expands the range of potential applications, enabling its use in dynamic scenarios, rapid inspection tasks, continuous monitoring processes, or integration with robotic platforms and mobile acquisition systems. The immediate availability of three-dimensional thermal information is particularly relevant in contexts where real-time decision-making or iterative thermal evaluation is required.
The experimental validation of the system was carried out in different indoor and outdoor scenarios, covering environments with varying geometric and thermal conditions. The obtained results demonstrate the feasibility of the proposed approach and its ability to generate dense, coherent, and spatially consistent thermal point clouds. Overall, the experiments highlight the potential of the system as a foundational tool for the generation of advanced thermal models and its application in areas such as technical inspection, energy analysis, environment digitization, and three-dimensional thermal monitoring.
Recent developments in the monitoring of marine pollution using remote sensing have focused on characterizing hydrocarbon products. However, only a few studies have examined the remote sensing of Hazardous and Noxious Substances (HNS), even though their release at sea can pose risks to human health, harm living resources, and other marine life. Unlike hydrocarbons, which generally remain on the surface of the water, HNS exhibit a wide range of behaviors, including volatile substances with high vapor pressure. The accidental release of these chemicals into the sea can lead to the formation of toxic, flammable, and/or explosive gas plumes. Consequently, developing effective response protocols is a major challenge for marine pollution authorities, given the significant environmental and human stakes involved.
Within the European MANIFESTS project (2021-2023), dispersion models were developed to provide information on the atmospheric propagation of volatile HNS. However, observational data are required to optimize the model parametrizations and adapt them to the marine environment. Remote sensing in the thermal infrared is a powerful tool for characterizing volatile HNS released into the sea because it enables the identification of (i) slick thermal contrasts on the sea surface and (ii) spectral absorption/emission of evaporating gas plumes.
Nevertheless, the maritime environment is characterized by low thermal contrasts compared to continental surfaces. This can lead to mis-detecting and mis-quantifying gas plumes when using traditional infrared spectral imaging. Moreover, gas plumes are typically associated with extended chemical slicks rather than point sources.
In this work, a new method is presented for estimating gas flow rates per slick unit area using a cooled infrared multispectral imager called SIMAGAZ. SIMAGAZ is a pre-industrial imager with four spectral bands in the long-wave infrared (7.2-8.5 µm), a high acquisition frequency (up to 75 Hz), and a very low radiometric noise (<10 mK per band). The algorithm flowchart includes the following steps: (i) gas detection using spectral correlation, (ii) estimation of the integrated gas concentration by inverting a dedicated radiometric model, (iii) a gas velocity field derived from the Farnebäck optical flow algorithm, (iv) estimation of the gas mass flow rate based on the Cross-Sectional Flux method, and (v) estimation of the gas flow rate per slick unit area using thermal detection of the slick surface.
This method has been applied to several volatile HNS during experiments conducted at different scales in the CEDRE facilities, including laboratory scale (product confined to a Petri dish) and seawater pool scale (product spilled over a few square meters). Image sequences were acquired from the ground using SIMAGAZ for several minutes.
The results presented for two volatile HNS (butyl acetate and acetone) show a good agreement between the laboratory scale and balance measurements for gas mass flow rate, as well as between the laboratory and pool scales for gas flow rate per slick unit area. This approach can now be extended to large-scale datasets acquired under open-sea conditions during the MANIFESTS project, and compared with atmospheric dispersion models to develop operational response tools.
Physiological reactions of plants are used in bioindication as early warning indicators of environmental stress. As part of a larger project aimed at developing repeatable remote sensing methodologies for monitoring crop performance and identifying environmental stressors relevant to precision agriculture and environmental surveillance, this work presents a quantitative approach based on drone-assisted thermography (UAV) using maize (Zea mays L.) as a bioindicator. To test the ability to detect stress signatures from drone observations, two experimental tests were developed: (i) an open-field agronomic scenario in which different fertilizations were considered, which can induce different canopy physiology, and (ii) a controlled environmental monitoring scenario (in tanks) in which maize was grown under soil-contaminated conditions (i.e., heavy metals Pb, Zn, Cr, and PAHs). Thermal data were collected through two flights: one with a Foxtech quadcopter equipped with a long-wave infrared (LWIR) sensor (MicaSense Altum), and one with an additional thermal camera on the DJI Mavic 3 Thermal drone. These flights were also used to cross-validate the sensors used. The Micasense Altum sensor also acquired multispectral images for spectral context (VIS–Red Edge–NIR), allowing for a joint interpretation of (a) functional thermal responses related to transpiration and canopy energy balance, and (b) structural responses from spectral indices. An end-to-end workflow was applied, from flight planning, through the necessary radiometric corrections and generation of the orthomosaic from which multispectral indices and thermal maps were extracted, to the extraction of canopy temperature statistics for the various scenarios considered. The results demonstrate that UAV thermography provides a solid functional contribution to bioindication, integrating spectral indices related to pigment content, chlorophyll content, and canopy vigor. The UAV-derived thermal and multispectral data were validated using ground-based measurements, confirming the reliability of the workflow in detecting maize stress. To quantify the importance of thermal information in identifying different maize stress conditions, several machine learning algorithms and related ablations studies were tested. The main limitation of using this data, compared to multispectral data, is the lower native LWIR spatial resolution, which increases mixed pixel effects (different land cover) and can alter canopy temperatures where cover varies between treatments. Conservative vegetation masking and boundary erosion mitigated this bias. Overall, the integration of UAV thermography and multispectral imaging can be effectively used, thanks to the concept of bioindication, both for agronomic optimization processes and for contamination monitoring.
In infrared thermography, the measured surface temperature of a scene at a given time is typically presented as a thermogram. When the objective is to interpret temperature over time, analysis commonly requires visual comparison of multiple thermograms acquired sequentially. In practice, apparent temperature differences may arise not only from actual thermal changes but also from measurement uncertainty originating from the thermal imager, acquisition conditions, environmental variability, or target surface-related factors. If such uncertainty is not explicitly considered, both qualitative inspection and automated processing may overinterpret noise-level fluctuations as meaningful temperature dynamics of the observed surface.
In this work, we introduce the Transition Thermogram (TTG), a novel thermographic representation designed to integrate transient temperature behaviour and measurement uncertainty into a single two-dimensional image. TTGs are generated directly from thermograms acquired at two or three time points. The method is based on computing pixel-wise temperature differences between time points and evaluating these differences relative to uncertainty thresholds. The primary threshold reflects the expanded uncertainty of the thermal imager (0.3 °C). Optionally, an additional application-dependent uncertainty threshold can be introduced to account for further sources of variability; for example, in facial thermography this threshold may be 1.3 °C. Temperature variations that do not exceed the camera uncertainty are explicitly classified as no change, thereby suppressing fluctuations indistinguishable from measurement noise. When the second uncertainty threshold is applied, temperature changes are further categorised according to different levels of metrological significance without inflating the instrument uncertainty.
TTGs encode both the direction and level of temperature change through colour. Colour hue represents the direction or qualitative trend of the temperature transition, while colour saturation reflects the magnitude of change relative to the applied uncertainty thresholds. When computed from two time points, TTGs provide a compact map distinguishing stable regions from those exhibiting warming or cooling. When three time points are considered, the representation naturally extends to display more complex transient behaviours, such as monotonic heating or cooling, as well as changes in the direction of the temperature trend. In all cases, the visual encoding is explicitly governed by uncertainty-aware decision rules, ensuring that displayed transitions are metrologically defensible.
The proposed visualisation method requires only spatial alignment of the observed surface across thermograms and does not depend on specific acquisition protocols or hardware modifications. However, spatial misalignment, such as that caused by subject motion in facial thermography, can be mitigated by replacing pixel-wise temperature values with ROI-based metrics such as mean temperature. Consequently, TTGs are suitable for a wide range of infrared thermography applications concerned with temperature dynamics, as will be demonstrated in a practical application. By collapsing uncertainty-qualified temporal behaviour into a single image, TTGs enable rapid qualitative assessment of spatially heterogeneous transient thermal processes that may be difficult to interpret using conventional thermograms alone.
The uncertainty-aware nature of TTGs makes them particularly valuable for data-driven analysis and allows reliable data-based decisions. By explicitly suppressing temperature variations that fall within measurement uncertainty, TTGs provide more robust representations for feature extraction, statistical analysis, and machine learning workflows. Overall, the TTG offers a metrologically rigorous framework for visualising and analysing transient thermal behaviour, providing a solid foundation for both human interpretation and automated (AI-based) processing of thermographic time-series data.
Active infrared thermography is widely used in non-destructive testing due to its non-contact nature and high efficiency. However, its application to microcrack detection on highly reflective and thermally conductive metal surfaces remains challenging due to weak thermal contrast and background interference. In this paper, a novel feature extraction framework based on thermal signal spatial quasi-static reconstruction is proposed to enhance the detectability of microcracks from infrared image sequences. The method transforms spatiotemporal thermal responses induced by a moving laser source into a temporal sequence equivalent to pulsed thermography, enabling the application of advanced feature extraction techniques. Fourier Transform, Principal Component Transform, and Partial Least Squares Transform are employed to extract defect-sensitive features from the reconstructed data. A three-dimensional heat transfer model is developed to analyze the thermal behavior around microcracks and guide the reconstruction process. Experiments are conducted on a TC4 titanium alloy specimen with cracks ranging from 2 µm to 100 µm using a custom-built mobile laser scanning thermography system. Results demonstrate that the proposed method reliably detects cracks as narrow as 2 µm. Quantitative evaluation using signal-to-noise ratio (SNR) shows that feature extraction algorithms significantly improve defect visibility, particularly for suboptimal cracks. The combination of quasi-static reconstruction and feature extraction offers a promising solution for in-situ and miniaturized infrared inspection of microcracks in metallic components.
Subsurface corrosion inspection using active infrared thermography (IRT) has been extensively investigated in the literature, with the majority of studies focusing on rear-side inspection configurations. In these approaches, depth estimation is facilitated by the fact that the thermal response is dominated by the defect closest to the observation surface. In contrast, front-side inspection has received less attention, and existing studies have focused on defect detection in specific scenarios, without performing an analysis of the influence of inspection parameters or addressing depth estimation.
In many real-world applications, such as ship hulls, offshore structures, and large steel components, access to the rear side of the structure is not possible. As a result, front-side inspection often represents the only feasible configuration, although depth discrimination becomes more challenging, as all subsurface defects are located at similar distances from the observation surface. This work presents an experimental study evaluating the capabilities and limitations of front-side subsurface corrosion inspection using active IRT, with a focus on identifying configurations suitable for efficient integration into autonomous inspection systems.
The study is conducted using a long-wave infrared (LWIR) camera combined with halogen lamps under the long-pulse thermal (LPT) technique. Artificial corrosion defects are introduced in steel specimens to enable a controlled and reproducible evaluation. Defects with diameters of 10 mm, 5 mm, and 2 mm are produced, with depths ranging from 0.1 mm to 2.0 mm. This enables the analysis of the influence of both defect size and depth on the front-side thermal response.
All experiments are performed in reflection mode, with the camera and heating sources placed on the same side of the specimen. Several inspection configurations are evaluated by varying key parameters, including inspection distance (40 cm, 60 cm, and 100 cm), heating power (1700 W, 970 W, and 500 W), and excitation duration (20 s, 10 s, 5 s, and 2 s). Defect detectability is quantitatively assessed using the contrast-to-noise ratio (CNR). In parallel, the temporal evolution of the thermal response is analyzed to evaluate its sensitivity to defect depth, using the critical time at which the thermal responses of defect and sound areas converge.
The results show that, under suitable inspection conditions, the use of an LWIR camera with the LPT technique enables both the detection of subsurface corrosion and the estimation of depth-related information. However, as thermal excitation decreases, these capabilities degrade. They are not coupled: depth-related information is lost first, while the defect may remain detectable.
Overall, this work provides an assessment and practical guidelines for front-side subsurface corrosion inspection, clarifying the achievable detection limits and depth estimation. The results help address a significant gap in the literature and support the use of front-side thermographic inspection in scenarios where rear-side access is unavailable.
Casting is widely used to produce complex-geometry metallic aerospace components such as turbine blades. Mold filling, heat transfer and solidification control the microstructure, mechanical properties and final geometry. Typical defects include gas porosities (open or closed cavities generated by degassing of superalloys during solidification) and shrinkage porosities (cavities created by local solidification shrinkage when the remaining liquid cannot feed the contracting solid). These micrometer-sized pores degrade the mechanical performance of parts and assemblies [1].
To ensure the quality and traceability of aero-engine components, non-destructive testing (NDT) is performed throughout manufacturing. Detection of micrometric surface defects currently relies mainly on penetrant testing, which involves chemical products, multiple processing steps and no digital data. In this context, Safran is investigating non-conventional inspection methods, in particular active thermography using induction and laser heating, capable of delivering digital data. This work focuses on laser-heated active thermography. While laser thermography is widely reported for detecting millimeter-long cracks with micrometric openings [2–3], its application to microporosities with diameters of a few tens of micrometers remains sparsely documented, especially for cast components [4].
The technique consists in locally scanning the surface with a focused laser beam while measuring the induced temperature field using an infrared camera. A surface-breaking or near-surface pore increases the local thermal resistance, slows down heat diffusion and generates a local surface overtemperature. Subsequent processing of the infrared image sequences (spatial filtering and Fourier-based analysis) enhances defect-to-background contrast and enables accurate localization of indications.
The study combines numerical modelling in COMSOL with experiments on cut turbine blades previously inspected by penetrant testing. The heat transfer module is used to build a realistic model of the laser surface heat source, accounting for the local angle of incidence and for the spatial and temporal distributions of the heat flux. The influence of the laser beam cross-section on heating homogeneity and defect detectability is analyzed for different excitation modes (continuous scanning, pulsed and lock-in).
Experimentally, a 938 nm point laser mounted on an optical scanning device is coupled to a FLIR X6581sc infrared camera. Comparisons of thermal responses obtained on sound areas and on areas exhibiting penetrant-testing indications show that microporosities are detectable using active laser thermography. These results, together with those obtained using induction heating, will be used to assess the potential of active thermography to replace penetrant testing for the industrial inspection of turbine blades.
[1] S. Roskosz, “Evaluation of porosity of precision castings made of high-temperature creep resisting nickel superalloys”, Praktische Metallographie / Practical Metallography, 50(8), 527–547, 2013.
[2] N. Puthiyaveettil et al., “Laser line scanning thermography for surface breaking crack detection: modeling and experimental study”, Infrared Physics & Technology, 104, 2020.
[3] N. W. Pech-May et al., “Robot-assisted crack detection on complex shaped components using constant-speed scanning infrared thermography with laser line excitation”, Applied Research, 4, 2024.
[4] M. I. Silva et al., “Review of conventional and advanced non-destructive testing techniques for detection and characterization of small-scale defects”, Progress in Materials Science, 138, 2023.
Rising damp is one of the main degradation mechanisms affecting historic masonry buildings and represents a major challenge for the conservation of cultural heritage. The assessment of rising damp is intrinsically complex due to the heterogeneous nature of masonry and the strong interaction between absorption, transport, and evaporation processes. Conventional diagnostic approaches are often based on invasive sampling or gravimetric measurements, which are poorly suited for in situ investigations and are generally incompatible with the requirements of cultural heritage conservation. Consequently, there is a growing demand for non-destructive techniques capable of providing quantitative information on moisture transport while preserving the integrity of historic structures.
Within this framework, Quantitative InfraRed Thermography (QIRT) offers a promising non-destructive alternative, as it enables the observation of surface thermal patterns associated with moisture-related phenomena. Variations in surface temperature are strongly influenced by evaporation processes occurring in wet areas, making IR thermography particularly suitable for detecting and monitoring moisture in porous building materials.
The present contribution represents the continuation and methodological advancement of the work presented by Guolo et al. (2024), in which passive IR thermography was applied to the monitoring of moisture diffusion and capillary rising damp in masonry materials. Building upon those results, this study aims to establish quantitative correlations between capillary rise parameters derived from thermographic analysis and the physical properties of the materials, with the objective of advancing toward a standardized and fully non-invasive diagnostic methodology suitable for in situ applications.
Experimental investigations were carried out on clay bricks commonly employed in restoration interventions and representative of traditional Venetian architecture. The materials were characterized through measurements of bulk density, porosity, and capillary water absorption, obtained using standardized laboratory procedures. Capillary rise experiments were performed under controlled environmental conditions and monitored using passive IR thermography.
The recorded temperature data allowed the qualitative identification of dry and wet regions and the quantitative tracking of the wetting front progression, enabling the determination of characteristic parameters such as the inflection point and the rising velocity of the capillary front. The temporal evolution of the rising damp front derived from IR analysis exhibited a square root of time dependence.
The results demonstrate that passive QIRT can provide quantitative information on capillary moisture transport without the need for direct contact or gravimetric measurements. The proposed approach represents a further step toward the standardization of IR thermography for the in-situ assessment of rising damp and supports its application for long-term monitoring and preventive conservation strategies in historic masonry structures.
The efficiency of vapor compression cycles (VCC) such as those used in aeronautical Environmental Control Systems (ECS) is heavily dependent on the performance of the evaporator. A critical technical challenge related to the latter is the maldistribution of two-phase refrigerant flow within the header and channels, which can lead to thermal losses of up to 30%. With the pressing transition from high-GWP refrigerants like R134a to low-GWP alternatives such as R1234ze(E), characterizing these flow behaviors in complex geometries is essential for revising and optimizing heat exchanger design.
The experimental setup comprises a full-scale VCC loop that operates with R1234ze(E), developed within the PANTTHER Clean Sky 2 project. It features a semi-hermetic reciprocating compressor and a plate-and-fin evaporator. The evaporator includes two passes of parallel channels on the refrigerant side and a single pass with wavy fins on the air side. The orientation of the evaporator header and channel can be modified, along with the inlet and outlet tube positions.
To quantify refrigerant flow maldistribution, an infrared (IR) thermography methodology monitors the front side of the evaporator first pass. A set of 1000 IR images is acquired at 50 Hz and time-averaged for each test condition. From these averaged images, 18 refrigerant channel profiles are extracted. A uniformity distribution coefficient (Φ) is calculated using the methodology established by Bowers et al., based on the estimated height at which superheated vapor is produced in each channel. This coefficient ranges from 0 (extreme maldistribution) to 1 (perfect uniformity).
The air outlet temperature is investigated using four thermocouple rakes installed on the air side of the evaporator outlet. These rakes contain 26 type K thermocouples that are positioned according to the ISO 3966 standard account for potential spatial temperature variations. By linearly interpolating the thermocouple measurements in the X and Y direction, a two-dimensional temperature contour of the air downstream of the evaporator is obtained. The uniformity of this temperature contour is as well evaluated by means of a mixing effectiveness criterion.
The work will focus on the comparison between the refrigerant maldistribution estimated using IR images (only considering first pass distribution), and the maldistribution estimated using the air temperature contour. The comparison will examine three specific evaporator orientations and inlet/outlet configurations. The effectiveness, limitations, and potential for IR thermography as a non-intrusive technique for maldistribution quantification, as well as correlation to the maldistribution quantified using air temperature contours will be discussed.
Remote thermographic inspection of wind turbines, either from the ground or from the air (drones), has great potential for condition monitoring throughout their entire service life However, the formation of measurable thermal contrasts on individual components depends heavily on dynamic weather conditions. A systematic and quantitative description of the observed effects is missing in literature, both because of the complexity of weather conditions and the lack of information about the internal structure of the rotor blades under investigation.
In order to study the evolution of thermal contrasts while reducing the variety of external influences (e.g. solar irradiation or strong wind gusts), a series of tests was carried out in a climate chamber. The object under investigation was a section of a wind turbine rotor blade (WTB) with a known internal structure.
In this study the climate chamber was used to heat and cool the test object as evenly as possible. To this end, air at a predetermined temperature was blown into the chamber. The IR camera used to observe the temperature distribution on the surface of the WTB-section was also located inside the climate chamber.
To gain a deeper understanding, an FE model of the WTB geometry was created and the temperature distribution under the influence of changing air temperature was simulated using COMSOL. Although all parameters for the thermal simulation are known in principle, it was not possible to achieve an optimal fit of the simulated temperature curve to the measured data by varying the parameters. Instead, a systematic deviation between both curves was observed, with a maximum difference of 0.4 K. Several underlying factors contributing to the observed deviation could be identified including:
1. non-uniform heating of the WTB-section (decreasing intensity of heating from up to down)
2. inadequate compensation of external temperature variations in the temperature calibration model of the infrared (IR) camera
3. Air infiltrates the specimen, which sides were only partially sealed.
4. Non-uniform initial temperature distribution within the WTB-section, despite the extended waiting times
In principle, all of the aforementioned effects could be incorporated into the simulation to enhance its precision. However, the original objective of a simulation without free parameters would demand a series of further investigations to experimentally quantify the influence of those disturbances
In summary it is evident that even in ostensibly rudimentary thermographic experiments, precise thermal simulation remains challenging, particularly when only minor thermal contrasts significantly below 0.1 K are to be considered.
An airtight building envelope is necessary to achieve a high thermal efficiency of the building, to prevent mold, for sound proofing and to meet fire safety standards. The total leakage rate of a building is measured with the fan pressurization method described in ISO 9972 or the pulse air permeability test. When airtightness found to be inadequate, leaks are often localized using a combination of previous knowledge of weaknesses of the envelope, fog generators or anemometers. Infrared images taken with a building set under pressure with a blower door can also emphasize leaks. More advanced thermographic methods for leak detection, like differential images or Lock-In Thermography, have been reported, but have found little adoption by the energy consulting community.
Lock-In Thermography has proven to be a reliable method of non-destructive testing in controlled environments. When this method is used in building inspections, it poses particular challenges, as it must deliver clear and unambiguous results in constantly changing environmental conditions. Goal of the presented research is to improve the usability of Lock-In Thermography for leakage detection at buildings by improving the robustness of the detection with respect to changing environment, like changing wind or solar irradiation, or moving objects visible in reflected surfaces. This would enable measurement of the outward-facing side of the facade allowing quick screenings of large facades. This is achieved by two methods: increasing the temperature-signal by inversion of pressure and application of additional digital filters.
Pressure inversion has been investigated using a laboratory test bench with a sample of medium density fiber board, square channels with two 90°-angles from 3 mm to 8 mm characteristic width and length from 32 mm to 512 mm. Changing the pressure signal from 0 Pa/ +50 Pa to -50 Pa/ +50 Pa resulted in a mean increase of the temperature amplitude by a factor of 2.4. Digital filters tested are phase filters and a novel local maximum filter.
In field campaigns both methods have been tested at several buildings. These measurements show the benefits compared to standard techniques and demonstrate the robustness of Lock-In Thermography for leak detection at buildings und challenging environmental conditions.
Jet impingement is a widely used forced convection technique characterized by a stagnation region and a radially developing wall jet, which can markedly thin the thermal boundary layer near the stagnation region and produce locally high heat transfer rates [1]. It is applied in systems with high heat fluxes and tight thermal constraints, including gas turbines, electronics [2], and grinding processes [3].
Conventional steady jets are typically generated by nozzles or open pipes supplied with compressed air, delivering relatively collimated flows whose thermal performance depends mainly on Reynolds number and nozzle-to-plate distance. In many industrial settings, the energetic cost of compressed air and the demand for more uniform, high-flow-rate jets motivate alternatives. Coandă-based air amplifiers use a small primary compressed-air flow to entrain ambient air, increasing total mass flow while potentially improving jet uniformity. Their performance depends on internal geometry and operating pressure. In the present work, air amplifiers are experimentally investigated to (i) determine local and average convective heat transfer coefficients over a heated thin foil, employed as a distributed heat-flux and temperature sensor in conjunction with Infrared Thermography (IRT), and (ii) compare their cooling performance with a conventional steady jet under matched reference conditions.
The devices under study (Meech A15005 and A15008) are annular anodized aluminium air amplifiers in which a primary flow is accelerated through an adjustable slit, generating a low-pressure region that entrains ambient air. The slit setting controls the primary mass flow rate and the entrainment ratio. The amplified jet impinges normally on a thin constantan foil, electrically heated by Joule effect. The nozzle-to-foil distance is adjusted through a micrometric positioning system. Surface temperature fields are measured by IRT, and convective heat transfer coefficients are obtained from an energy balance accounting for radiative and conductive losses.
Results are presented as time-averaged Nusselt maps. A high-Nusselt region appears in the central impingement zone and decreases toward the periphery. At small H/D the field is more localized and slightly non-axisymmetric, whereas larger H/D produces a smoother and more axisymmetric distribution.
Results are interpreted in terms of pneumatic efficiency by relating average heat transfer rates to primary compressed-air consumption to identify favorable operating envelopes, defined by supply pressure and nozzle-to-foil distance, where air amplification can offer a better balance between cooling effectiveness and energy expenditure compared with conventional jet impingement.
References
H. Martin, Heat and mass transfer between impinging gas jets and solid surfaces, Advances in Heat Transfer, vol. 13, pp. 1–60, 1977.
D. Babic, D. B. Murray, A. A. Torrance, Mist jet cooling of grinding processes, Int. J. Mach. Tools Manufact., vol. 45, pp. 1171–1177, 2005.
Y. Cheng, A. A. O. Tay, X. Hong, An experimental study of liquid jet impingement cooling of electronic components with and without boiling, Proceedings of the International Symposium on Electronic Materials and Packaging, IEEE, pp. 369–375, 2001.
Production test hardware for manufacturing semiconductor devices enables the assurance of quality and performance as part of the semiconductor manufacturing process, strongly required for providing defect-free and reliable high-performance products in challenging and safety-relevant application areas such as automotive, data centers, consumer devices and industrial machinery and automation. The production test of high-power semiconductor devices is particularly demanding for test hardware since high currents in fast switching scenarios are to be applied to semiconductor devices on wafer level via miniscule contacting needles in probe-cards ass front-end connecting equipment in high throughput production testers. The high electrical currents applied via probe card needles lead to extremely high current densities thus challenging thermal conditions, since such needles for power devices have a typical diameter of only 63 µm (2.5 milli-inch) and a contact area to the device surface to be tested of about 20 µm. As heavily required for high throughput high volume production tests the used probe card needles must reliably conduct high currents without a damage of overheating in ten to hundred thousand of contacts and current tests without degradation and service.
The contribution of this work is the thermal investigation of high speed high current loads on probe card needles via active thermography in order to assess the thermal load, the related thermal distribution and flow conditions in typical and extreme application conditions. We demonstrate high speed microscopic thermal investigations at frame rates above 1500 Hz with an optical resolution below 5µm. The requirement is on one hand to carry several short consecutive high DC currents pulses: as e.g. 2 A for several pulses with 3 ms duration. On the other hand, for longer time duration lower DC currents, as e.g. 0.8 A are applied. Previous simulations showed that the temperature of the contact region increases already during the couple of ms heating pulse up to 500 K, but afterwards it cools down quickly. On the other hand, in the body of the probe needle the heat accumulates and it becomes warmer and warmer after several heating pulses.
In order to be able to investigate this thermal behavior a test setup has been prepared for infrared microscopy. The test wafer has been cut so, that the contacted needles are at the surface. Additionally, they have been blackened to increase the emissivity. A cooled IR camera with microscopic lens has been used (IRcam Velox 1310SM) with a spatial resolution of 2 µm/pixel. The test setup was positioned below the microscope lens and the electrical current was applied to the needles. The electrical current application and the recording the IR images were synchronized.
Several experiments with different window sizes have been carried out: large windows to measure the temperature increase of the probe bodies after several seconds and small windows to inspect the probe heads close to the contacting region. With decreasing the window size the recorded frame rate was increased up to 1600Hz, providing a sufficient temporal resolution even during the 3 ms heating pulses.
The mid-wave IR camera records in the wavelength range of 3-5 µm. Due to diffraction of the IR waves and the given MTF of the used lens, the blurring of the IR images with 2µm/pixel resolution could not be avoided, but even so, the experiments show very good agreement with the simulations.
Electrothermal Modelling of Totem-Pole PFC Converter
P. Górecki , M. Strąkowska , R. Olbrycht , R. Kasikowski *
* Łódź University of Technology, Institute of Electronics, 211/215 Wólczańska Str, 90-924 Łódź, Poland, rafal.kasikowski@p.lodz.pl
** Gdynia Maritime University, Department of Ship and Industry Automation, 81-87 Morska Str, 81-225 Gdynia, Poland, p.gorecki@we.umg.edu.pl
Abstract
1.Introduction
Power converters, due to their nonlinear load characteristics, generate significant mains harmonics, necessitating power factor correction (PFC) to prevent power quality degradation. PFC, usually in the form of dedicated modular circuitry, adjusts the input current waveform to align in phase and shape with the input voltage to achieve a high power factor. The latter, along with power conversion efficiency, remains a key performance parameter of current designs. The Totem-Pole topology (Fig. 1) combines the advantages of traditional PFC topologies with the elimination of the diode bridge rectifier and naturally facilitates the use of high-performance gallium nitride (GaN) transistors. The power loss generated in converters can be predicted using SPICE-based models that employ the electrothermal analogy to represent thermal phenomena with electrical equivalents.
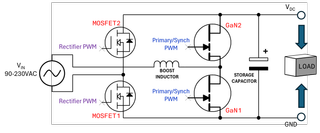
Fig. 1 Totem-pole PFC topology.
2.Electrothermal modelling framework
Circuit-level simulations of power converters serve as an effective tool in optimizing their design process. Accurate predictions of losses across all components facilitate optimal selection of switching frequency and suitable components. To confirm the applicability of the components in the design, their temperatures are calculated over the range of planned operating conditions. A primary challenge in electrothermal circuit-level transient simulations of power converters arises from the substantial disparity in time constants. The shortest, which determines the maximum simulation time step, corresponds to the rise and fall times of the power transistors used and is on the order of a dozen nanoseconds, whereas the longest, which determines the simulation duration, represents the longest significant thermal time constant. For PCB assemblies where free convection prevails in thermal dissipation, this duration can attain several kiloseconds. Consequently, performing electrothermal simulations within reasonable time requires dedicated methods and multiple simulation programs.
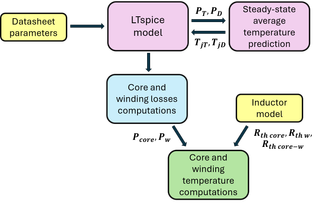
Fig. 2 Block Diagram of Electrothermal Modelling Framework.
LTspice served as the primary simulation program (Fig. 2). To address time constant disparities in the simulated converter, a segregated iteration method was employed: after every three input voltage periods, component temperatures were updated via the .IC command, with simulations repeated until results following three periods varied by no more than 1°C from initial values. The computations of approximate steady-state temperatures were performed in MATLAB using the average values of power dissipated in all components computed in LTspice and their Rthj−a thermal resistances. As input data for the simulations, all electrical parameters were estimated solely from the datasheets of the components used, while the thermal parameters were estimated using FEM modeling and datasheets.
3.Conclusion
In the full paper, simulation results are compared with measurement data. The temperatures of all power components predicted by the proposed model are validated against thermographic measurements performed on the investigated converter (Fig. 3).
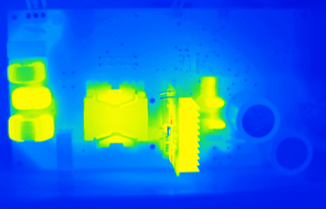
Fig. 3 Thermal image of investigated totem-pole PFC converter.
4.References
[ 1 ]. Z. Liu; F. C. Lee; Q. Li; Y. Yang, Design of GaN-Based MHz Totem-Pole PFC Rectifier, IEEE Journal of Emerging and Selected Topics in Power Electronics, Vol.4, No. 3, pp. 799 – 807, 2016, DOI: 10.1109/JESTPE.2016.2571299.
[ 2 ]. N. Mohan, W. Robbins, T. Undeland, R. Nilssen, O. Mo, Simulation of Power Electronic and Motion Control Systems—An Overview, Proceedings of the IEEE, vol. 82, no. 8, pp. 1287-1302, 1994, DOI: 0.1109/5.301689.
Efficiency of Power Conversion and Power Loss Estimation of Totem-Pole PFC Converter Based on IR Thermography
M. Strąkowska, P. Górecki *, R. Kasikowski *
* Łódź University of Technology, Institute of Electronics, 211/215 Wólczańska Str, 90-924 Łódź, Poland, rafal.kasikowski@p.lodz.pl
** Gdynia Maritime University, Faculty of Electrical Engineering, 81-87 Morska Str, 81-225 Gdynia, Poland, p.gorecki@we.umg.edu.pl
Abstract
This paper presents a practical methodology for estimating power loss of Totem-Pole PFC Converter based on infrared thermography. The proposed approach enables contactless, real-time assessment of thermal behavior during normal system operation, without requiring circuit modifications or interruption of service. Unlike conventional methods that rely on datasheet parameters or pre-production characterization, IR thermography captures the actual thermal signature of the assembled PCB under realistic operating conditions, load profiles, and environmental factors. The main aim of this work is to validate and correlate thermal measurements with electrical power dissipation, creating empirical relationships between surface temperature distributions and actual power losses that account for PCB geometry, ambient conditions, and component packaging.
1. Introduction
Components with the high heat production such as power MOSFETs, GaN transistors, inductors, power resistors or high-current traces require special attention when evaluating power dissipation [1, 2]. These elements typically operate near their thermal limits and are most susceptible to thermally-accelerated aging. Traditional power loss estimation methods rely on datasheet parameters and circuit simulation, which may not accurately reflect real-world operating conditions or account for manufacturing variations and aging effects.
Infrared thermography presents a powerful non-invasive diagnostic tool for power loss estimation in operational PCB assemblies. By capturing the thermal signature of individual components and circuit regions, IR imaging enables direct measurement of surface temperature distributions under realistic operating conditions. When combined with thermal modeling and heat transfer analysis, these temperature measurements can be inversely correlated to power dissipation levels, providing empirical validation of theoretical calculations and revealing discrepancies caused by aging, manufacturing tolerances, or suboptimal thermal design.
2.Thermal model of the printed Circuit Board
Evaluation Board NCP1681CCM1KWGEVB is modeled using a nodal thermal network. The board is divided into several thermal nodes: six represent heat sources, and two represent the PCB surfaces. Figure 1a presents the evaluation board with marked heat sources and Figure 1b the daughter board with GaN transistors.
a)
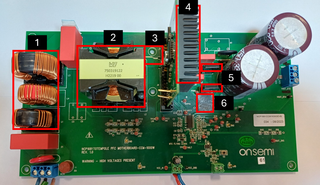
b)
Figure.1 Totem pole evaluation board with marked heat sources (a) and daughter board with GaN transistors (b)
a)
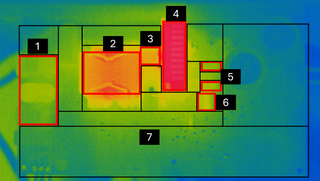
b)
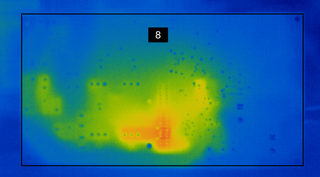
Figure 2. Infrared image of PCB board - top view (a), bottom view (b) with marked regions (black rectangles - PCB surface, white rectangles - heat sources)
The measurements were performed using an OPTRIS PI450 non-cooled IR camera to estimate heat losses and power efficiency in the circuit based on the PCB topology and IR thermography. The input voltage was 230 V, and the power efficiency was estimated for two output power levels: 100 W and 200 W. Heat loss from each node to the surrounding environment occurs through both convection and radiation. For each surface node, convection and radiation are treated as parallel heat transfer mechanisms acting simultaneously.
The PCB is oriented vertically on its longer side so the values of C=1.42 and n=0.25 [3 ]. The height is L=0.114" m". Assuming ΔTo=10∘C, the resulting heat transfer coefficient is ho=4.35 W/m2K.
\begin{equation}
h_c = C \left( \frac{\Delta T}{L} \right)^n
= \frac{C}{L^n} \left( \frac{\Delta T}{\Delta T_0} \right)^n (\Delta T_0)^n
= \frac{C (\Delta T_0)^n}{L^n} \left( \frac{\Delta T}{\Delta T_0} \right)^n
\end{equation}
\begin{equation}
h_c = h_0 \left( \frac{\Delta T}{\Delta T_0} \right)^n
\end{equation}
The radiative heat transfer coefficient is estimated using the Stefan–Boltzmann law.
After a few transformations of Stefan-Boltzmann equation and approximations, the heat flux [4 ] is expressed as:
\begin{equation}
q \approx \sigma \cdot 4 T_a^{3} \left( T - T_a \right) = h_r \, \Delta T
\end{equation}
For Ta=300K, the radiative heat transfer coefficient is hr=6.23 W/(m2 K).
The total heat flux from a node to the ambient is therefore expressed as the sum of the convective and radiative heat fluxes. This allows the definition of a total heat transfer coefficient to be defined as the sum of the convection and radiation coefficients.
\begin{equation}
q = h_r \Delta T_S + h_c \Delta T_S = (h_r + h_c)\,\Delta T_S
\end{equation}
Based on the PCB topology and the dimensions of the heat sources, we estimate the heat fluxes for each node in a manner similar to that shown above. Total power loss is the sum of the power losses in each of the nodes. Based on the obtained values, the power efficiency was estimated. The results are shown in table 1.
Table 1. Power efficiency obtained by electrical measurement, model, and datasheet.

3.Conclusion
The presented method allows estimating power efficiency and power losses based on thermographic measurements. The obtained results agreed with the values provided in the documentation. The inaccuracies in the results may be due to the limited precision of the thermal camera used, the estimation of average temperatures and surface areas, as well as the varying emissivity of components on the PCB. Nevertheless, the results indicate that the proposed method is suitable for estimating power losses. Such a method can be used, for example, to monitor changes in heat loss that occur due to the aging of electronic components. The presented methodology offers several advantages. It requires no circuit modification, permits measurements during normal operation, provides spatial resolution sufficient to identify localized hotspots, and enables longitudinal studies tracking thermal performance degradation over the product’s lifetime. The proposed IR thermography-based approach facilitates both initial design validation and ongoing condition monitoring, supporting predictive maintenance strategies and enhancing overall system reliability.
4.References
[1 ] Julio Lázaro Ramos Martínez, Harold Crespo Sariol, M. Mercedes Pérez de la Parte, B. Sáenz-Diez Pérez, Emilio Jiménez Macías, Jan Yperman, Dries Vandamme, Heat-loss measurement using infrared thermography by multi-threshold analysis, Applied Thermal Engineering, Volume 279, Part A, 2025,
[2 ] Langer, Gregor & Leitgeb, Markus & Nicolics, Johann & Unger, Michael & Hoschopf, Hans & Wenzl, Franz. (2014). Advanced Thermal Management Solutions on PCBs for High Power Applications. Journal of Microelectronics and Electronic Packaging. 11. 104-114. 10.4071/imaps.422.
[3 ] https://www.electronics-cooling.com/2001/08/simplified-formula-for-estimating-natural-convection-heat-transfer-coefficient-on-a-flat-plate/,
[4 ] Więcek, B., & De, M. G. (2011). Termowizja w podczerwieni: Podstawy i zastosowania. Wydawnictwo PAK.
Detailed inspections of aircraft bodies are designed to detect and characterize damages, whether accidental (impact) or progressive (mechanical fatigue, ageing), and affecting the integrity of the aircraft structure. These inspections, mainly non-destructive tests (NDT), are carried out as part of planned maintenance operations or following the detection of damage. They are time-consuming, requiring the dismantling of parts of the aircraft to access the inspection zone, or the use of lifting equipment to access a high part of the aircraft. Automating these tasks using ad-hoc inspection systems is a very attractive solution for reducing the time and cost associated with these inspections. In this context, we developed a multi-sensor robotized NDT platform coupling two inspection modalities: visible light for surface damage detection, and infrared light for in-depth damage detection. Infrared detection is based on active thermography, in which the robotic arm carries both the imaging system and a thermal exciter. Acquisition is performed in line-scan mode, by heating the sample at constant speed, angle and distance to the arm before the IR camera collects the thermal response. In this way, each area of the sample is guaranteed to be scanned with more uniform sampling conditions. Compared to classical static flash thermography, this extra degree of freedom makes it possible to inspect parts with considerable curvature, such as aircraft fuselages and nacelles. Internal damage of such parts can be accessible with better confidence. The 3D cartography of the composite part is recorded by a depth camera and used to calculate the optimum scanning trajectory for the inspected parts. The thermal and visible field is then provided ad-hoc with damage localization. A detailed characterization of the multi-modal robotized NDT platform developed at ONERA was carried out to evaluate its ability to reliably detect internal defects in aeronautical composite structures. A sensitivity study was conducted in line scan thermography operating mode to determine the detection limit in a CFRP composite plate with calibrated detects. The integration of advanced thermal data processing algorithms, particularly variational auto-encoders algorithms, has proven to significantly improve internal defect detectability and robustness to imaging constraints, such as defocus. A multi-parameter study on a lightning-struck composite plate with real internal damage was conducted to optimize line-scan inspection, supported by a parametric simulation study. The links between line scan velocity and damage detection sensitivity have been investigated, and line-scan parameters were optimized with regard to the depth of internal damage. Ongoing efforts focus on deploying these methods for damage monitoring in aeronautical applications, utilizing 3D camera-acquired cartography.
Professor Stefano Sfarra attained a Ph.D. title in mechanical, management and energy engineering at the University of L’Aquila (UNIVAQ), Italy, in 2011. Following the achievement of the Ph.D., he was a research fellow at UNIVAQ until 2017, before becoming a researcher in October of the same year.
He carried out research and teaching periods abroad at prestigious institutions all over the world. He was also an invited-scientific researcher at Tomsk Polytechnic University (Tomsk, Russia), as well as a member of several scientific committees at international conferences.
He is also an editor of Infrastructures (MDPI), and Sensors (MDPI). Since December 2020, he is the editor-in-chief (EiC) of the Quantitative InfraRed Thermography (QIRT) Journal (Taylor & Francis). He is deeply involved in the non-destructive evaluation and characterization of materials, especially using optical and infrared vision non-destructive testing techniques, numerical simulations centered on heat transfer phenomena (by Comsol© Multiphysics), development of ad hoc scripts in Matlab©environment, and inverse thermal modelling.
In these research areas, Prof. Sfarra authored or co-authored more than 300 papers in Journals and International Conferences. He also have written seven chapters in Books. He is currently acting as a reviewer of around 50 scientific journals; he is principal investigator, collaborator and local contact person in international research projects.
He is also a member of Associazione MASTER, Associazione Italiana della Fisica Tecnica and Associazione Italiana Proprietà Termofisiche.
He received many awards, mainly focused on scientific recognition.
In October 2020, he became associate professor at UNIVAQ. He has been an adjunct professor at Laval University (Canada).
Infrared thermography captures surface temperature fields that can visualize subsurface defects, yet conventional analyses are hampered by sensor noise and imperfect heat-conduction models. The physics-guided (informed) neural reconstruction framework can be developed embedding heat-transfer priors within a deep network to recover a denoised, physically consistent background from raw thermal sequences. Differential maps between this reconstruction and the original measurements selectively amplify defect contrast while suppressing background clutter. Thanks to examples, effectiveness is demonstrated on laboratory-fabricated and handmade specimens, yielding improved background restoration, more reliable defect characterization, and the estimation of unknown physical parameters such as, e.g., the material’s thermal diffusivity. Comparison with standard (well-recognized) techniques are also discussed.
Abstract
Thermal imaging presents challenges for image registration due to uncorrelated temperature variations among objects, low inherent texture, reduced feature saliency, and modality-dependent contrast behaviour that differs from visible-spectrum imagery. These issues are particularly pronounced in thermal-to-thermal and thermal-to-visible registration tasks, where traditional handcrafted feature detectors and descriptors often exhibit poor repeatability and limited cross-modality robustness. As a result, learning-based approaches have become increasingly prominent in infrared thermography workflows. This work investigates deep point descriptors for thermal image registration under two scenarios: (i) mono-modality registration between thermal images, and (ii) cross-modality registration between thermal and visible (RGB) images. While classic handcrafted approaches (e.g., SIFT, ORB, and variants) remain widely used for visible-spectrum imaging, their performance often degrades on thermal data due to low feature saliency and poor repeatability across modalities. Recent literature indicates that machine learning (ML) and deep learning (DL) based methods consistently outperform classical pipelines by learning modality-invariant and thermally stable feature representations. Convolutional Neural Networks (CNNs) and Vision Transformers (ViTs) have emerged as dominant backbone architectures for learning robust thermal descriptors, with CNNs providing strong locality and ViTs offering improved global context aggregation.
Motivated by this, we present a comparative analysis of CNN- and ViT-based point descriptors for thermal registration. Models were trained and evaluated using publicly available datasets released under a CC-BY-4.0 license. Two different test sets were prepared to evaluate descriptor performance using positive (correct matches) and negative (incorrect matches) pairs. Metrics included mean and median L2 distances for positive and negative sample pairs, as well as False Positive Rate at 95% True Positive Rate (FPR@95TPR), a standard accuracy metric in feature matching.
In a subset of our evaluation, Test Set 1 (167,768 matching pairs) showed that both backbones achieved 95% TPR, with CNN marginally outperforming ViT on positive pair discrimination: the ViT positive mean was 0.2923 vs. 0.2045 for CNN, and the positive median was 0.2703 vs. 0.2014. Negative mean distances remained similarly high for both models (1.3977 for CNN vs. 1.3915 for ViT), suggesting comparable separation for non-matching descriptors. CNN achieved a slightly lower FPR@95TPR (0.00528 vs. 0.00552), reflecting marginally better suppression of false matches at the same recall level. Similar trends were observed in Test Set 2 (27,636 pairs), where CNN achieved lower positive mean (0.2035 vs. 0.3121) and median (0.2008 vs. 0.2901 ) and with ViT having modestly higher FPR@95TPR (4.37e-05 vs. 1.29e-05). While negative means remained high for both (1.3909 for CNN vs. 1.3971 for ViT). In both cases, CNN models demonstrated improved feature discrimination and retained slightly tighter control over false positives
Non-Destructive Testing (NDT) is fundamental for guaranteeing industrial structural integrity, with Infrared Thermography (IR) highlighted for its non-invasive detection capacity and no harmful radiation. However, the dependence on manual parameterization and the complexity of analyzing transient data poses a difficulty for the development of automated system for failure detection. This work proposes the development of optimized and generalist models based on Deep Learning (DL) for failure detection using infrared thermography, aiming to reduce human intervention. The developed methodology used the PVC-Infrared dataset, selecting 5 specimens subjected to Pulsed Thermography (PT) containing artificial, i.e. previous known, defects. Raw data was first processed with two well-known techniques - Thermographic Signal Reconstruction (TSR) and Principal Component Thermography (PCT) - for contrast enhancement and noise reduction. From the processed images, 50 Regions of Interest (ROIs) were extracted, balanced between failure and integrity classes. Experiments were performed with these 5 different structures to evaluate method robustness under sample variations. Training was conducted with 36 samples (stratified between training and validation), while the evaluation was performed on 14 samples not used in the adjustment. This separation strategy reinforces evidence of generalization, indicating that the methodology does not limit itself to memorizing patterns, but preserves the capacity for discrimination in unprecedented data. In the testing stage, model calibration indicated an optimal decision threshold of 0.7677. The model reached, in the test set, an Accuracy of 92.86%, Precision of 100% (absence of false positives), and an Intersection over Union (IoU) of 0.8571. These results exceed classic semantic segmentation architectures applied to the same dataset such as U-Net and SegNet and demonstrate competitiveness with the state of the art, validating the effectiveness of the ROI-based approach and advanced pre-processing for automated monitoring applications. The next steps include evaluating the performance of the proposed methodology for different materials, e.g., training with PVC samples and testing with composites and metal samples.
Laser-based additive manufacturing processes require precise monitoring of meltpool geometry to ensure process stability, dimensional accuracy, and metallurgical quality. Infrared thermography provides a non-contact, high-speed sensing solution capable of capturing thermal emission during laser–material interaction. However, extracting reliable geometric and energetic features from meltpool images remains challenging due to high dynamic range, sensor noise, blooming effects, and rapid temporal variations inherent to the process.
Conventional image processing techniques, including fixed global thresholding, adaptive thresholding, morphological filtering, contour extraction, and ellipse fitting, are commonly used for meltpool segmentation. Although these approaches are computationally efficient and suitable for real-time implementation, they are strongly dependent on threshold selection and local intensity normalization. Adaptive methods can artificially stabilize the segmented region, reducing sensitivity to subtle geometric changes, while fixed thresholds increase sensitivity but become unstable under background drift and fluctuating thermal conditions. As a result, small yet physically relevant variations in meltpool morphology may be masked or exaggerated, compromising the robustness of feature extraction for control loop integration.
To overcome these limitations, this work proposes a deep learning-based segmentation pipeline for real-time meltpool monitoring using thermographic image data acquired during a laser-based manufacturing process. A dataset of infrared images was manually annotated at pixel level to generate ground-truth segmentation masks. A U-Net++ architecture was selected due to its multi-scale feature aggregation capability and improved boundary reconstruction, enabling accurate delineation of the meltpool region under varying thermal conditions.
The trained network was exported to ONNX format and deployed within a real-time inference pipeline using ONNX Runtime with GPU acceleration, allowing integration into an industrial monitoring framework. From the predicted segmentation masks, physically meaningful descriptors were extracted, including meltpool width (via minimum-area rectangle fitting), segmented area, and energy-related metrics derived from baseline-subtracted intensity integration within the detected region.
The neural segmentation approach was quantitatively compared with classical image processing strategies under varying laser power levels. Results indicate improved spatial consistency, enhanced sensitivity to process-induced variations, and reduced dependence on manual parameter tuning. In addition, inference latency measurements confirmed compatibility with real-time industrial constraints. These findings demonstrate that deep neural segmentation, when coupled with physically grounded feature extraction, provides a robust and scalable framework for quantitative thermographic meltpool monitoring in industrial additive manufacturing environments.
Within the framework of Brighter project new multispectral (MS) microbolometers are designed, developed and integrated in new infrared camera prototypes. These prototypes are implemented and tested on various use-cases. In the present study, the Sense-City (https://sense-city.ifsttar.fr/) large scale facility was selected to conduct experiments on urban small cities buildings and roads in controlled and monitored environment.
A first campaign of experimentation in the SenseCity large scale Climatic chamber was realized. Two tiny cities were investigated, one in controlled climatic conditions (Tiny City 1) and the other one in natural environmental conditions (Tiny City2).
During experimentations, three controlled climate conditions were imposed over the Tiny City 1 and listed below:
• Tair +22°C and 50% HR
• Tair +30°C and 80%HR
• Tair +10°C and 80%HR
Experimentations over the Tiny City 2 were conducted under natural climate.
During these experiments, surface temperature probes were added to the existing in-situ ones to collect complementary measurements (for instance: additional surface temperature, local relative humidity, …) for different built surface of interest studied in the Tiny City 1 & 2. Furthermore, a prototype of portable emissometer developed in collaboration THEMAC Ingenierie, equipped for the v1 version with only 4 spectral bandwidth capabilities was also tested in operation for the first time.
The 4 spectral bandwidths implemented in the portable emissometer prototype are:
1. 8.73-10.21 µm (Cuton – Cutoff 5%)
2. 9.46 - 12.34 µm (Cuton – Cutoff 5%)
3. 2.96 – 5.06 µm (Cuton – Cutoff 5%)
4. 11.63 – 13.01 µm (Cuton – Cutoff 5%)
During these experimentations, MS camera prototypes were operated with and without a 6 positions filter wheel equipped with 5 spectral band filters.
A double characterization of the different urban building surfaces positioned in different climatic conditions MS camera measurements with BRIGHTER algorithms and emissivity measurements using the portable emissometer prototype were conducted.
A first analysis of preliminary results obtained will be proposed and discussed. Focus, on few built spectral surfaces will be also discussed. Conclusion and perspectives addressing the generation of a public dataset for the community will be introduced.
Acknowledgments
Authors wish to thank Jean-Pierre Monchau from THEMACS Ingenierie for the development of the 4 spectral bands portable emissometer prototype in the framework of BRIGHTER project. BRIGHTER project has received funding from the Chips Joint Undertaking (Chips JU) under grant agreement N°101096985. The JU receives support from the European Union’s Horizon Europe research and innovation program and France, Belgium, Portugal, Spain, Turkey
Unmanned aerial vehicles (UAVs) equipped with infrared imaging systems have emerged as a promising tool for the assessment of energy performance in building envelopes. By enabling non‑contact, rapid, and wide‑area observations, UAV‑based thermal inspections offer new possibilities for identifying heat loss and performance irregularities that are difficult to detect using conventional, ground‑based methods.
This review provides an overview of the current state of research on the use of UAV‑mounted infrared thermography for building envelope energy audits. Rather than focusing on specific systems or experimental configurations, the review broadly examines how this technology has been applied in the context of building envelope evaluation, including common objectives, general workflows, and reported benefits. The review highlights the growing interest in aerial thermography as a complementary tool for envelope diagnostics, condition assessment, and energy performance evaluation.
At the same time, the review discusses commonly reported limitations and challenges associated with UAV‑based thermal inspections, such as sensitivity to environmental conditions, data interpretation uncertainties, and practical constraints related to operation and implementation. These challenges underline the need for cautious interpretation of thermal data and continued methodological development.
By synthesizing findings from existing literature and practices, this review aims to provide a high‑level perspective on the opportunities and challenges of UAV‑based energy auditing of building envelopes. The review concludes by outlining general directions for future research and development to support more reliable, standardized, and accessible use of aerial infrared thermography in building envelope energy audit.
Thermal Protection Systems (TPSs) of space vehicles must withstand extreme thermal fluxes and high temperatures during atmospheric re-entry, making emissivity one of the key parameters to be accurately characterised. Infrared thermography, combined with complementary diagnostics such as pyrometers and thermocouples, enables emissivity characterisation of TPS materials when heated under controlled conditions in high-temperature furnaces. Moreover, thermographic measurements performed during hypersonic Plasma Wind Tunnel testing allow the simultaneous investigation of temperature and emissivity in environments representative of atmospheric re-entry conditions. However, the practical application of radiometric thermography is often affected by significant challenges. Emissivity varies with material properties, wavelength, temperature, and surface condition, introducing substantial uncertainty in the conversion of radiance maps into reliable temperature distributions. This issue is particularly critical for innovative TPS materials, for which emissivity may not be known a priori. To overcome these limitations, this work also investigates a free emissivity thermography technique applied to infrared thermographic systems, enabling temperature determination. The results demonstrate the practical viability of free emissivity thermography for accurate radiometric temperature measurements and for the simultaneous reconstruction of two-dimensional temperature and spectral emissivity maps, supporting the qualification of space materials under re-entry-relevant conditions.
Modern military operations routinely unfold under low visibility and strict concealment constraints. In these conditions, estimating time-since-discharge and recent firing patterns from passive sensing alone - without active illumination or other emitters - is critical to reduce misidentification and associated casualties. Passive IR observations, particularly thermal imagery, can preserve stealth while providing actionable cues about a weapon’s recent activity and thermal state, supporting rapid decisions that mitigate civilian harm and the risk of friendly-fire incidents.
Contemporary modeling offers a broad spectrum of approaches for object recognition and feature extraction, each balancing robustness, domain transfer, and interpretability. In this work, we prioritize reliability and physical interpretability by analyzing localized thermal measurements through heat-dissipation models to estimate recent discharge activity and support rapid assessment in low-visibility scenarios (assuming prior identification of the firearm). Because the core inference relies on model-based and classical vision routines rather than learned representations, the method transfers across sensing platforms and firearm geometries with minimal re-parameterization, avoiding extensive retraining when deployed to new configurations.
Our approach analyzes passive thermal imagery using heat-dissipation models to estimate recent discharge activity and support time-critical assessment. The dataset comprises thermal sequences from multiple firearm platforms with key structural features, such as the disposition of moving parts (influencing overall heat transfer) and the material thickness (mainly associated with heat capacity), so that results can be easily extrapolated to similar devices, ranging from low-energy ammunitions (9mm) to high-energy ammunitions (.357 Magnum).
Preliminary results show the viability of obtaining characteristic thermal decay curves for each analyzed firearm model, thus establishing weapon-specific decay profiles, depending on discharge parameters. These profiles allow for temporal estimation for tactical decision-making processes, where discrimination between weapons fired after various time frames is achievable. The resulting database of thermal-temporal signatures for military firearms provides a significant milestone towards developing autonomous classification systems.
The results foreground the potential of employing physics-informed analytics as a means of facilitating an assessment of discharge events in low-visibility conditions, passively and covertly. The methodology has direct utility in verification of rules of engagement, forensic analysis and real-time threat assessment systems to minimize incidents in complex battlespaces, where the identification of combatants and non-combatants remains an enduring challenge.
Infrared thermography (IRT) is a well-established non-destructive testing (NDT) technique widely used for detecting and characterizing defects in materials and structures. It offers a contactless and wide-area inspection capability, enabling the rapid evaluation of thermal responses that indicate subsurface anomalies. However, in many cases, raw thermographic data do not exhibit clear defect patterns due to noise, emissivity variations, or environmental interferences. Consequently, post-processing techniques have become essential to enhance defect visibility and extract reliable diagnostic information.
Among the most recognized approaches are statistical moment analysis, Pulse Phase Thermography (PPT), Principal Component Thermography (PCT), and Thermographic Signal Reconstruction (TSR). These methods respectively aim to highlight subtle thermal variations, separate defect-related information in the frequency domain, reduce data dimensionality to isolate dominant thermal patterns, and smooth temperature evolution curves to improve contrast. While these methods have demonstrated significant potential in controlled environments, their deployment in industrial settings remains limited by computational constraints. Processing high-resolution thermographic sequences with thousands of frames requires substantial computational power, which challenges real-time implementation in in-line inspection systems.
This work investigates the acceleration of classical post-processing methods for infrared thermography through the use of modern hardware platforms, particularly Graphics Processing Units (GPUs) and edge computing devices. Optimized implementations of several established algorithms are presented, leveraging efficient vectorized operations and the parallel computation capabilities of GPUs. The proposed implementations achieve remarkable performance gains, reducing execution times to below 35 ms for sequences of 2000 frames of 512 × 512 pixels—equivalent to over 524 megapixels processed per sequence. These results demonstrate that GPU- and edge-based architectures can enable real-time or near-real-time defect analysis, significantly improving the practical feasibility of IRT in demanding industrial environments.
This work also provides a detailed analysis of the computational optimization strategies that contribute to the achieved acceleration. Techniques such as vector data processing are exploited to maximize throughput. A comparative study between different GPU architectures and embedded systems demonstrates that even low-power edge devices can deliver competitive performance when algorithms are carefully tuned to their hardware characteristics. This finding is particularly relevant for applications where portability, energy efficiency, and cost are major constraints.
Beyond acceleration, the study explores the scalability and deployability of these techniques on embedded edge computing platforms. The experiments confirm that edge devices can perform most post-processing operations locally, reducing data transmission demands and allowing for low-latency decision-making in field conditions. This capability is essential for autonomous inspection systems, predictive maintenance, and continuous quality monitoring aligned with Industry 5.0 principles, which emphasize human-centricity, resilience, and sustainability.
The implementations developed in this work are released as open-source software to promote transparency, reproducibility, and adoption within the NDT community. The availability of these tools is expected to facilitate benchmarking, encourage collaborative research, and support the development of next-generation thermographic inspection systems. By bridging the gap between algorithmic development and practical deployment, this study demonstrates that optimized GPU and edge computing solutions can transform infrared thermography from a laboratory analysis technique into a powerful real-time industrial diagnostic tool.
The increasing focus of the aerospace industry towards component reusability has made non-ablative material largely employed for Thermal Protection System in spacecraft atmospheric re-entry missions. In this work, special CMC TPSs obtained with ISiComp®, a Ceramic Matrix Composite (CMC) reinforced with carbon fibres, have been studied, paying special attention to the monitoring of the surface integrity. ISiComp TPS, indeed, are coated with silicon carbide (SiC) in order to enhance their high-temperature performance and to mitigate the surface erosion during re-entry phases. That is why the availability of a reliable, non-destructive methodology for the assessment of both the substrate and coating integrity—for manufacturing quality control and also for post-flight inspection after multiple missions—has become essential. ,
With this aim,NDT techniques based on Infrared Thermography (IRT) have been investigated in order to evaluate their effectiveness in assessing the surface as well as the integrity of the coating of a set of ISiComp samples. Several thermographic techniques, sensor configurations, and data analysis algorithms were implemented and systematically compared to investigate their capability in identifying material state variations. The results demonstrate that the proposed IRT-based methodology is capable of reliably discriminating between coated, uncoated, and oxidized material conditions, providing a robust and scalable framework for the health monitoring and assessment of reusable spacecraft TPS components
Spray cooling is a high-performance thermal management technique capable of dissipating extremely high heat fluxes while enabling compact system designs. It is regarded as a key enabling technology in applications where conventional air or single-phase liquid cooling is no longer sufficient, including power electronics and high-performance computing, aerospace and defense systems, high-power laser and optoelectronic devices, as well as industrial and automotive thermal management.
Its exceptional performance derives from the exploitation of the latent heat of evaporation, allowing heat flux dissipation exceeding 1000 W/cm² with water and over 100 W/cm² with dielectric fluids, while ensuring uniform cooling of localized hot spots.
However, spray cooling effectiveness is strongly influenced by surface–liquid interactions, and smooth surfaces often suffer from dry spot formation or excessively thick liquid films, which degrade heat transfer and promote premature critical heat flux (CHF) conditions.
To mitigate these limitations, surface engineering at the millimetric, micrometric, and nanometric scales has been extensively investigated.
At the millimetric scale, macro-structures such as straight fins, pin fins, and pyramidal geometries have demonstrated significant enhancements in heat transfer coefficient (HTC) and CHF compared to flat surfaces, mainly due to increased wetted area and improved liquid management.
Among these configurations, straight fins generally provide superior performance owing to efficient drainage, channeling effects, and stable operation under inclined spray conditions. Nevertheless, despite the extensive literature on conventional millimetric structures, the potential of offset strip fins with millimetric hydraulic diameters in spray cooling applications remains largely unexplored.
Offset strip fins are widely adopted in compact heat exchangers due to their ability to significantly increase heat transfer area and promote flow disruption, thereby enhancing convective heat transfer. Their interaction with impinging sprays, and their influence on liquid redistribution, film thinning, and evaporation mechanisms, have not yet been systematically investigated.
This work aims to address this gap by experimentally studying spray cooling on offset strip fin surfaces, with emphasis on quantitative surface temperature mapping.
The primary objective of the study is to assess whether offset strip fins can enhance spray cooling performance compared to conventional millimetric fin geometries, and quantify the influence of surface orientation. Experiments are conducted for both horizontal and vertical surface orientations using water as the working fluid, to evaluate the role of gravity on liquid drainage and fluid management. Surface temperature measurements are obtained using infrared thermography and thermochromic liquid crystals, enabling a quantitative comparison between the two measurement techniques. The combined IR–TLC approach is used to validate temperature mapping and to establish an uncertainty framework for thermographic measurements during spray impingement and evaporation.
The experimental approach is designed to characterize heat transfer phenomena including cooling efficiency and thermal non-uniformity, through metrics such as spatial temperature non-uniformity and hotspot statistics, and to provide insight into the coupled effects of surface geometry, orientation, and spray–surface interaction mechanisms for high heat flux thermal management applications.
The paper presents cooling system based on the Indirect Regenerative Evaporative Cooling concept. The developed prototype of the IREC system for electronics cooling is presented. Cooling relies on forced convection, where air is significantly cooled through evaporation. The system features two types of channels - dry and wet, through which the cooled air and moist air circulate. Water is supplied via porous membranes in the wet channels. The cooling system was tested in conditions of higher ambient temperature at the inlet.
Prototype of IREC system for electronic applications
Among different heat dissipation systems, the Indirect Regenerative Evaporative Cooling (IREC) becomes attractive as if can sustain effecting in the high ambient temperature. IREC is typically implemented by 2 thermally coupled air channels: dry (DC) and wet (WC) as shown in fig. 1a. Dry air passing DC is cooled down significantly due to the evaporation process in WC. The heat source is placed at the end of DC and beginning of WC, where the airflow cools down this source. This is the cooling area for an electronic device and the heating point for the dry air. Next, the heated dry air is directed to WC with wet walls made of the porous membranes sucking the water from the reservoir nearby. While air is flowing in WC, evaporation generates the cooling flux q as presented in fig 1a. Fig. 1b shows the wall of the dry channel during assembling the exchanger.
The mounted exchanger is presented in fig. 2 on the testing rig. This rig is equipped with numerous sensors in the different points for measure temperature, relative and specific humidity, pressure p and air velocity v. As seen in fig. 2b on the thermal image, the heat is generated by a power elements in the front side. There is a part of heat dissipated directly by natural convection to ambient. In order to reduce this leak of energy, the heat source was insulated by a box made of styrofoam.
Results
The measurement results are gathered in table 1. The measurement points 1…4 referring to ambient, DC outlet, WC inlet and WC outlet correspond to the numbers presented in fig. 1. In the experiment, the ambient temperature was increased above 40C by an external heater. The power P=12 W was dissipated in the electronic device generated the stabilized temperature T=45C using the PID controller.
InfraRed Thermography (IRT) enables real-time, non-contact thermal inspection without harming the object or producing hazardous radiation and provides two-dimensional temperature distributions to detect early signs of structural irregularities, supporting continuous structural health monitoring across various industries. While thermal imaging can reveal the presence of damages, it is extremely difficult to directly identify specific damage mechanisms due to overlapping effects in the measurement chain, including the heat source, thermal propagation, detection system, signal processing, and data interpretation. Therefore, a combination of numerical and experimental approaches is essential for a comprehensive study of the entire heat transfer process. Halogen lamps are commonly used in active IRT for defect detections due to the high intensity of their emitted radiant heat flux and affordability; however, modelling the radiant heat flux from these sources is challenging due to their non-uniform heating, which can lead to errors in defect characterizations and temperature measurements, requiring careful input calibration to ensure accurate simulation results. This study emphasizes the experimental characterization of the radiant heat flux emitted by a halogen lamp in terms of both its spatial and temporal distributions using a fluxmeter sensor, and the development of three-dimensional heat transfer models incorporating the derived heat flux for IRT measurement chain simulations. The simulation results are validated through experiments performed on an acrylonitrile butadiene styrene (ABS) plate using both pyrometer and IRT measurements. The outcomes provide a clear understanding of the radiant heat flux characteristics of the halogen lamp and enable the definition of accurate boundary conditions for active IRT simulations, thereby enhancing the reliability and accuracy of the numerical results. Validated results show strong agreement with the simulations in terms of the temporal evolution of temperature distributions. These findings confirm the effectiveness of the calibrated heat sources and the proposed heat transfer models, providing a robust framework to improve the accuracy of numerical simulations for defect and damage detection using the IRT technique.
Keywords: Non-Destructive Evaluation (NDE), InfraRed Thermography (IRT), IRT simulation, Heat transfer modelling, Radiant heat flux.
The broad applicability and effectiveness of impinging synthetic jets (SJs) in thermal management have motivated extensive efforts to refine their design through systematic examination of key parameters, including stroke length and Reynolds number [1–2]. Earlier investigations [3–4] have demonstrated that nozzle geometry plays a significant role in determining the heat transfer of impinging SJs. However, these studies did not consider the temporal or spatial evolution of the heat transfer coefficient on the impinged plate, as the results were limited to time-averaged pointwise measurements.
The current work focuses on the influence of the nozzle exit section shape (NESS) on the heat transfer behaviour of SJs. Four different shapes are comparatively assessed: the circular (C), the triangle (T), the square (S) and the rectangular (R) NESS. To capture the spatio-temporal evolution of the heat transfer behaviour, phase-locked 2D infrared thermography measurements are carried out for five nozzle-to-plate distances: H/D ∈ [2,4,6,8,10] The Reynolds and Strouhal numbers are kept constant to Re = 3500 and Sr =0.068.
The heat transfer behaviour is significantly modified by the NESS, especially for short impingement distances. Upon ejection, the coherent vortical structures inherit the geometry of the issuing nozzle, hence the Nu maps show the signature of the impinging vortical structures. Whereas, as the vortical structures are convected downstream, they lose their geometrical coherence due to inertial instabilities and, at high nozzle-to-plate distances, the SJ’s thermal footprint on the foil is almost bell-shaped, with all NESSs achieving a heat transfer similar to the circular nozzle.
Additionally, phase-averaged measurements revealed the complex evolution of the heat transfer coefficient during the actuation period of the SJ.
References
$\left[1\right]$ Carlo Salvatore Greco et al. “Effects of the stroke length and nozzle-to-plate distance on synthetic jet im pingement heat transfer”. In: Int. J. Heat Mass Transf. 117 (2018), pp. 1019–1031. DOI: 10.1016/j.ijheatmasstransfer.2017.09.118.
$\left[2\right]$ M. Chaudhari et al. “Heat transfer characteristics of synthetic jet impingement cooling”. In: Int. J. Heat Mass Transf. 53.5 (2010), pp. 1057–1069. DOI: https://doi.org/10.1016/j.ijheatmasstransfer.2009.11.005.
$\left[3\right]$ P. Gulati et al. “Influence of the shape of the nozzle on local heat transfer distribution between smooth flat surface and impinging air jet”. In: Int. J. Therm. Sci. 48.3 (2009), pp. 602 617. ISSN: 1290-0729. DOI: https://doi.org/10.1016/j.ijthermalsci.2008.05.002.
$\left[4\right]$ M. Chaudhari et al. “Effect of orifice shape in synthetic jet based impingement cooling”. In: Exp. Therm. Fluid Sci. 34.2 (2010), pp. 246–256. DOI: https: //doi.org/10.1016/j.expthermflusci.2009.11.001.
An experimental and numerical study of high-speed gas-dynamic and thermal processes is carried out, which are realized during the simultaneous interaction of the plane shock wave (SW) and its co-flow with 1) shock tube test camera walls 2) the combined pulsed (submicrosecond) volume discharge in the test camera 3) the axisymmetric sphere-blunted cylinder model after volume discharge initiation. Computer Fluid Dynamics (CFD) simulations of the gas flow were performed and compared with panoramic data from high-speed shadow recording (150,000 fps) and infrared thermography imaging (up to 2,000 fps). Infrared radiation was recorded through the channel's side walls using a Telops FAST M200 camera.
CFD simulation of the compressible non-stationary gas flow was carried out using Navier-Stokes equations. The main goal of this simulation was to analyze the motion and evolution of the main flow discontinuities, as well as the effect of energy release and energy conversion to thermal fields. The effect of the discharge on the flow was simulated, the discharge energy converted to flow was determined. Various methods of the obtained numerical data visualization are used for adequate
matching CFD data with experimental data (shadowgraphy and thermography). Phenomena related to both plasma and gas-dynamic interactions in the shock tube test (discharge) chamber are investigated.
Through test camera quartz windows, transparent to the infrared radiation, images of non-stationary thermal fields, recorded by the infrared camera are obtained. They are: 1) thermal fields of the internal surfaces of the channel including side windows and model surfaces, heated for up to 200-300 microseconds by the cocurrent flow behind the SW due to thermal conductivity by the boundary layer 2) gas layer in front of the model (between the bow shock and model edge) heated during the stationary supersonic flow with bow shock 3) plasma radiation of a pulse volume discharge localized in front of the moving shock wave.
Laser sintering of metal micro- and nanoparticles commercial pastes is a promising route for fabrication of high-resolution conductive patterns on temperature-sensitive substrates. However, the narrow processing window between insufficient sintering and substrate damage remains a major challenge, particularly for copper-based materials prone to oxidation and pore formation.
In this work, high speed infrared (IR) thermography is employed as a non-contact diagnostic and control tool to monitor and optimize the laser sintering of approximately 100 µm-wide copper-based conductive lines deposited on an indium tin oxide (ITO)-coated silicon substrate. Sintering is performed using a continuously moving CO2 laser, while surface temperature fields are captured in real time using a FLIR X6981 infrared camera. The high spatial and temporal resolution of the IR measurements enables direct observation of transient thermal profiles generated by the relative motion between the laser spot and the printed line. To account for transient changes in surface emissivity associated with solvent evaporation and progressive oxidation during sintering, the raw FLIR camera data were post-processed using an in-house scripting routine. This correction enabled dynamic adjustment of the emissivity parameter during heating, improving the accuracy and consistency of the extracted temperature fields across the different sintering regimes. Elliptical temperature distributions are consistently observed, reflecting the combined effects of laser scanning speed, spot size, and thermal diffusion within the copper paste and substrate.
Surface temperature mapping is used to delineate three distinct processing regimes: unsintered regions, well-sintered conductive tracks, and substate-damage regions. A critical upper temperature threshold of approximately 230°C is identified, beyond which cracking for the ITO-coated silicon substrate occurs. By avoiding local overheating and inhomogeneous sintering, the thermograph-guided approach enables systematic exploration and optimization of the laser processing window.
Electrical conductivity, porosity, and defect formation are correlated with the measured thermal histories. For the printed lines, conductivity initially improves with increasing laser power due to enhanced particle necking and densification. However, further increases in energy input led to rising resistivity because of excessive pore formation, oxidation, and localized overheating. Minimum contact resistivity values as low as 7mΩcm2 are achieved under optimized conditions that promote dense neck formation without inducing thermal damage.
Quantitative thermal metrics, including peak intensity, heating and cooling rates, effective sintering temperature, and dwell time, are extracted from the IR data using FLIR Research Studio software. These metrics are indirectly correlated with cross sectional scanning electron microscopy SEM and an analytical thermal model to assess in depth-wise sintering and thermal diffusion, as well as with porosity measurements and electrical characterization. The analysis highlights the dominant roles of laser energy density and the ratio of laser spot size to line width line width in determining sintering uniformity and electrical performance.
Finally, a set of predictive metrics based on effective energy density, total energy input, and energy transfer rate is proposed to guide process optimization. Overall, this study demonstrates that high-speed thermography provides an effective and scalable methodology for mapping, controlling, and optimizing temperature fields during laser sintering of cooper-based conductive lines.
Resistance spot welding is the process used in the automotive industry to assemble body-in-white. A high current allows the melting temperature of steel sheets to be reached by Joule heating in a few milliseconds.
An experimental setup was developed to measure the contact temperature during welding. A high-speed infrared camera equipped with a G1 microscopic lens is used. The measurement is biased by the source size effect.
We propose a method to quantify and correct for this effect and obtain an accurate temperature reading.
Recent EU climate policies and international reporting standards, including OGMP 2.0, have imposed stringent requirements on methane emissions from the oil and gas sector. Due to its high global warming potential, methane has become a major regulatory target, with industrial flares used for waste gas disposal required to achieve at least 99% methane destruction efficiency. These requirements aim to reduce the release of unburned hydrocarbons and support the transition from estimated emission factors to direct field measurements.
This work presents experimental results obtained on a mobile Esders degassing flare with a maximum gas flow rate of 209 m³/h operating under purely diffusive combustion conditions. Two complementary techniques were applied to quantify methane destruction: direct gas sampling with a Flame Ionization Detector (FID) and passive Fourier-Transform Infrared spectroscopy (pFTIR). The former requires physical access to the combustion plume and careful positioning of the sampling probe to avoid secondary oxidation and excessive dilution by ambient air. The latter enables remote acquisition of absorption–emission spectra from a distance of approximately 30 m, yielding column concentrations in ppm·m.
In the contact method, unburned methane was quantified using the equation:
$ E_{\mathrm{CH_4}} = OGC_{\mathrm{wet}} \cdot \frac{21}{21 - O_2} \cdot V_{\mathrm{wet}} \cdot \frac{M_{\mathrm{CH_4}}}{M_{\mathrm{C}}} $
where OGC denotes the organic carbon content in the exhaust gas, O2 represents oxygen content, and the remaining terms account for dilution correction and carbon-to-methane conversion. Experimental data showed that 6.531 g of methane remained unburned out of 716.1 g supplied, corresponding to a destruction efficiency of 99.09%.
In the pFTIR method, methane destruction was evaluated using the carbon balance:
$ DE = 100 \cdot \frac{CO_2 + CO}{CO_2 + CO + THC_w} $
where total hydrocarbons in the denominator represent unburned fuel fractions. Analysis of 52 independent spectra resulted in an average destruction efficiency of 99.77%, while radial calculations yielded 99.75%, indicating excellent repeatability. As pFTIR does not require physical contact with the flame, it avoids issues associated with turbulence, condensation in sampling lines, or analyzer power supply, although it remains sensitive to atmospheric conditions such as humidity or precipitation.
Both methods yielded efficiencies above 99%, confirming compliance of the tested flare with EU and OGMP 2.0 requirements. The difference of only 0.66 percentage points between the lowest and highest value demonstrates consistency between the approaches. These results indicate that remote optical techniques, owing to their universality and operational safety, have strong potential to become preferred tools for field-based reporting of flare combustion performance, supporting the transition from literature-based estimates to true measurement-based quantification.
Infrared thermography is a reliable, non-destructive method for assessing the condition of ballasted railway track superstructures, with proven applicability in evaluating ballast and concrete sleeper condition as well as switch heater functionality. Fine particles generated by the fragmentation of ballast material under traffic loading accumulate within the ballast bed, reducing its strength and preventing efficient drainage; therefore, the condition of the ballast needs to be monitored regularly. This paper presents an analysis of ballast condition using infrared thermography conducted on a railway track section in the city of Zagreb. Measurements were performed using a Fluke TiS45 infrared camera to correlate recorded surface temperatures with the condition of the railway ballast. The key assumption is that the thermal properties of clean ballast differ from those of fouled ballast due to differences in fine particle content. The accumulation of fines in fouled ballast promotes water retention, resulting in lower ballast temperatures. This paper also examines the potential use of infrared thermography to detect water retention zones in urban railway tracks integrated into road surfaces and enclosed to the rail head level with precast concrete slabs. In these track configurations, effective drainage is difficult to achieve, leading to localized water accumulation that promotes aggressive corrosion of rails and fastening system components. Localized water retention causes capillary rise of moisture within the concrete slabs enclosing the track structure, which appears as reduced surface temperature in thermographic images.
The aerospace industry frequently employs hard coatings, such as chrome plating, on sealing areas of critical components to enhance surface durability and maintain functional tolerances. Achieving optimal coating thickness and surface finish typically requires meticulous grinding. However, this process can sometimes introduce grinding burns on the substrate material, which may or may not affect the coating itself. For ferromagnetic materials, conventional detection methods for such defects include penetrant testing and electromagnetic noise analysis using the Barkhausen effect. Recognizing the need for alternative, more efficient methods, Safran has explored the implementation of active infrared thermography combined with induction excitation, offering potential benefits in automation, digital data management, and the elimination of chemical processes.
This paper presents the collaborative efforts of Safran Landing Systems and Safran Tech in developing and industrializing a new inspection approach for detecting grinding burns under chrome plating on landing gear components. The project included the definition of requirements, the creation of suitable inspection protocols, and the execution of feasibility studies through representative specimens with artificial defects to full-scale industrial A320 sliders of main landing gear with artificial and natural defects.
The developed thermographic induction technique has proven highly effective in detecting millimeter-sized defects beneath chrome coatings with thicknesses of approximately 100 µm. Throughout a series of iterative laboratory experiments and on-site field trials, the project team refined and validated robust inspection procedures, centered around the use of a robotic cell to ensure consistency and scalability in an industrial environment.
The outcomes of this work clearly demonstrate that active thermography using inductive excitation stands out as an alternative to conventional inspection methods, such as penetrant testing and electromagnetic noise measurement (barkhausen effect), for the detection of grinding defects beneath metallic coatings. This approach enables non-contact, real-time, and fully automatable inspections, significantly enhancing both process traceability and operational safety. This innovative method represents a significant advancement in non-destructive testing for critical aeronautical components.
Active infrared thermography has emerged as a powerful, non-contact technique for the inspection of composite components, with Carbon Fiber Reinforced Polymers (CFRP) receiving particular attention due to their widespread use in the aerospace industry. In such critical applications, composite skins are frequently bonded to honeycomb core structures, which fulfill diverse roles ranging from geometric and structural support to acoustic attenuation. To meet these varied and demanding requirements, the design office must carefully select honeycomb core parameters—including material type (primarily aluminum or Nomex), as well as density, cell diameter, and height—in order to optimize the performance, durability, and functionality of the overall component.
This presentation investigates how the properties of honeycomb cores influence the effectiveness of active thermographic inspection, focusing specifically on the use of pulsed optical excitation for the detection of flaws located at the skin-to-core interface. A primary objective is to better understand the relationship between honeycomb architecture and the detectability of disbonds and other critical defects, which are particularly challenging to identify using conventional methods due to the complex structure and thermal behavior of these materials.
To thoroughly address these complexities, a comprehensive program of parametric and experimental studies has been conducted, targeting scenarios associated with increased detection difficulty. Experimental results highlight that thermal responses vary significantly between monolithic CFRP regions and those incorporating honeycomb cores. In particular, aluminum honeycomb structures are found to facilitate higher rates of thermal diffusion, which in turn enhance the thermal contrast and overall visibility of skin-to-core disbonds during infrared inspection. This effect becomes more pronounced as honeycomb density increases, confirming the critical role that core architecture plays in heat propagation and defect detectability. Conversely, Nomex honeycomb, characterized by low thermal diffusivity, presents substantial challenges for disbond detection, especially when thick monolithic layers—typically exceeding 3 mm—are present above the core. Detecting disbonds in such configurations often requires not only more sensitive inspection methodologies, but also a sophisticated understanding of thermal behavior, aided by advanced analytical and simulation tools.
Based on experimental findings, the authors will also propose simulation-based opportunities for a more comprehensive understanding of honeycomb effects aiming to reduce the fabrication of dedicated defective samples.
Casting is a manufacturing process in which a molten material is usually poured into a mold which contains a hollow cavity of the desired shape and then allowed to solidify. The casting process involves fluid flow, heat transfer, and solidification phenomena which together determine the microstructure, mechanical properties and dimensional accuracy of the final product. Casting is used for the fabrication of complex shaped parts such as turbine blades. Gas holes and shrinkages are the common defects that can occur during the process. They are closed or open spaces not filled with the casting material. These micrometer sized porosities degrade the mechanical performance of parts and assemblies.
To ensure the quality of the components, non-destructive testing (NDT) is performed throughout the manufacturing process. The detection of micrometer scale surface defects currently relies mainly on fluorescent penetrant testing, which involves chemical products, multiple processing steps and provides no digital data. In this context, Safran is investigating advanced non-destructive evaluation techniques, in particular active thermography using induction and laser heating, capable of delivering the digital data. This work focuses on induction heating based active thermography. While induction thermography is widely reported for detecting millimeter-long cracks, its application to porosities with diameters of a few micrometers remains sparsely documented. As the dimension of the defect becomes smaller, all the experiment parameters must be re-investigated for the successful implementation of induction thermography.
This study demonstrates the capability of induction thermography in detecting microporosities. Numerical modelling using COMSOL is utilized to understand the detection mechanism and to evaluate the influence of various experiment parameters in the detection of microporosities. These results, together with those obtained using laser thermography, will be used to assess the potential of active thermography to replace penetrant testing for the industrial inspection of turbine blades.
Ultrasound-excited active thermography method, which is frequently referred as vibrothermography or sonic-IR, is a promising non-destructive testing (NDT) technique. This technique involves exciting high-power ultrasounds in the inspected object while observing the surface temperature using an infrared camera. The ultrasonic vibrations induce frictional heat in the defective region in the object, enabling defect detection by identifying abnormal temperature regions in the observed thermal image. This inspection principle makes this technique highly effective for detecting closed defects such as closed cracks or poor adhesion (which are difficult to detect using other NDT methods). However, this technique should not be suitable for detecting voids or delaminations with large opening widths. Therefore, this study focuses on ultrasonic-excited active thermography inspection for delaminations in carbon fiber reinforced plastics (CFRPs), and quantitatively investigates the conditions under which delamination becomes detectable based on the opening widths of the delaminations and ultrasonic wave propagation. Active thermography inspections were performed on CFRP specimens with artificial delaminations, and after the inspections, the specimens were cut to observe the opening widths of the delaminations. The authors demonstrated in a previous paper that the waves excited in the inspected object are guided waves (the A0 mode Lamb waves in plate-like objects). The experimental results showed that delaminations could be detected when the opening widths were similar to or smaller than the amplitude of the standing waves generated by the propagation of guided waves in the specimens. On the other hand, the delaminations having larger opening width could not be detected (but only the edges of the delamination areas could be detected). Such large-width delaminations were clearly detected by conventional pulsed thermography method using xenon flash lamps, which was performed for comparison. These results imply that the amplitude of the input ultrasound or the active excitation method itself should be changed depending on the opening width of the defect to be detected. Detailed discussions on the relationship between detectable defect conditions and the waves propagating in the objects will be presented at the conference. These findings should be a fundamental guide for setting inspection conditions in ultrasound-excited active thermography method.
Active infrared thermography is widely adopted for non-destructive evaluation of composites, yet faces challenges including thermal diffusion-induced defect boundary blurring, excitation signal modulation effects on signal-to-noise ratio (SNR), and limited 3D defect morphology reconstruction accuracy. To address these limitations, an adaptive tomographic radar thermography (ATRT) method is proposed. ATRT introduces pixel-level membership to distinctly separate defect and healthy areas, achieving precise lateral boundary definition. The large time-bandwidth product pulse radar modulation is employed to ensure high-SNR excitation, while surface temperature differential-depth correlations is established for accurate depth inversion and complete 3D defect reconstruction. Frist, the defect detection process is formulated as a nonlinear optimization problem, solved through the integration of genetic and simulated annealing algorithms. Secondly, the relationship between defect depth and maximum temperature difference is derived from thermal conduction principles. Next, two complementary probability of detection models ATPE-POD and ERE-POD are formulated using asymptotic theory and resampling techniques, respectively, to evaluate diameter-to-depth ratio effects on detection capability. Finally, experimental validation on composite laminates reveals ATRT's capability. Results demonstrate that ATRT shows 90% detection probability for defects with diameter-to-depth ratios exceeding 1.11, while achieving 2-4 times higher SNR than traditional methods. The technique maintains under 10% radial size error in 3D reconstruction. Depth reconstruction accuracy exhibits a quasi-linear dependence on defect lateral dimensions, showing error reduction from 20% at 1.25 mm diameter to 8% at 7.0 mm diameter, while maintaining submillimeter depth resolution. ATRT provides an effective solution for structural health monitoring of composite materials, significantly advancing defect characterization capabilities.
QIRT 2026 group photo, in the stairs of Conference Hall
Abstract:
The human body relies on precise neurovascular regulation and coordinated thermogenesis/thermoregulation mechanisms [1]. It maintains relatively stable core body temperature even during extreme external temperature fluctuations, thereby supporting homeostasis and critical physiological functions [2, 3]. This study utilized mid- (MWIR) and log-wave (LWIR) infrared thermography to visualize the temperature field [4, 5] on the dorsal surface of the hand, quantifying bilateral thermal responses and systemic regulation induced by localized cold stimulation. First, the volar surface of the right hand was subjected to a -4°C cold plate of participants for four minutes of continuous cold exposure, while the left hand was subjected to room temperature, with simultaneous thermal imaging of both hands (approximately 2,400 thermal images per subject). Recovery, with both hands at room temperature, was then recorded for an additional four minutes. The study included 19 volunteers (13 males, 6 females; ages 18–53). Subsequently, regions of interest (ROI) were defined for the acquired data, which were processed using principal component thermography (PCT). PCT was employed to further highlight the ventral plexus (VP), thereby aiding in its localization. Temperature variations across different subjects were then visualized in selected areas through time-temperature plots. Deep learning (DL) methods were also used to improve the quality of the thermographic analyses. Results showed that the temperature of the VP in the stimulated hand decreased continuously during the cold exposure phase before rebounding, while the temperature of the unstimulated hand increased. Joint analysis of temperature distribution and time series revealed coupled rebalancing patterns in bilateral temperature dynamics. These findings indicate that localized cold stress triggers cross-limb vasomotor and thermal redistribution to mitigate external disturbances on core body temperature.
Significant references
1. Castrillón-Gutiérrez M, Olaya-Mira N, Viloria-Barragán C, et al. Protocol to evaluate human thermoregulation before and after thermal stress. MethodsX, 2024, 13: 102977.
2. Lahiri B B, Bagavathiappan S, Nishanthi K, et al. Infrared thermography based studies on the effect of age on localized cold stress induced thermoregulation in human. Infrared Physics & Technology, 2016, 76: 592-602.
3. Lahiri B B, Bagavathiappan S, Philip J. Infrared thermal imaging based study of localized cold stress induced thermoregulation in lower limbs: The role of age on the inversion time. Journal of Thermal Biology, 2020, 94: 102781.
4. Bouzida N, Bendada A, Maldague X P. Visualization of body thermoregulation by infrared imaging. Journal of Thermal Biology, 2009, 34(3): 120-126.
5. Usamentiaga R, Fidanza A, Yousefi B, et al. Advancing knee injury prevention and anomaly detection in rugby players through automated processing of infrared thermography: A novel biothermodynamics approach. Thermal Science and Engineering Progress, 2025: 103782.
Active infrared thermography (IRT) is a well-established non-destructive testing technique for detecting subsurface defects in materials by analyzing thermal responses to external excitation. However, defect detectability is often limited by noise, spatial non-uniformities, and the complex nature of heat diffusion in heterogeneous materials. Recent research has demonstrated that combining multiple post-processing methods or excitation sequences can significantly enhance the signal-to-noise ratio (SNR) and robustness of defect detection. Building on these advances, this work introduces an adaptive multi-domain fusion framework that integrates information from multiple temporal and frequency-domain representations to improve defect visibility under variable inspection conditions.
The proposed approach extends previous efforts on multi-sequence fusion and robust SNR modeling by incorporating both statistical and structural features of the thermographic response. Instead of relying on a single processing technique, the framework adaptively combines complementary results from several post-processing algorithms—such as Pulsed Phase Thermography (PPT), Principal Component Thermography (PCT), and Thermographic Signal Reconstruction (TSR)—along with different excitation sequences or acquisition settings. Each input contributes differently to defect highlighting depending on defect depth, material properties, and noise characteristics. By using a data-driven weighting strategy based on local SNR estimation and inter-method correlation, the system optimizes the contribution of each modality to produce a final defect-enhanced map.
A key contribution of this work is the integration of a robust SNR evaluation model that considers both the thermal signal evolution and the spatial context. This model provides a quantitative measure of the detectability improvement achieved through fusion, enabling objective comparison across experiments. Moreover, the method accounts for variations in emissivity, surface reflections, and environmental noise, which often degrade the reliability of thermographic measurements. By analyzing local signal fluctuations and temporal coherence, the algorithm effectively discriminates true defect-induced contrasts from noise-related artifacts.
Experimental validation was conducted on composite and metallic samples with artificial and natural defects using pulsed and modulated excitation. The results demonstrate that the proposed adaptive fusion strategy significantly increases SNR and contrast-to-noise ratio (CNR) compared to individual processing methods. Particularly for deep or low-contrast defects, the fused results reveal enhanced defect boundaries and improved consistency across repeated measurements. Quantitative analysis confirms up to 40% improvement in detectability metrics, highlighting the effectiveness of the multi-domain integration.
The proposed framework offers a general and flexible methodology for thermographic data enhancement, independent of the excitation scheme or sensor configuration. It can be easily adapted to different inspection scenarios, including lock-in, step-heating, and pulsed thermography. Future work will focus on extending the method with deep-learning-based fusion strategies and uncertainty quantification to further automate defect characterization and improve interpretability.
Energy performance in buildings is a critical issue for researchers and engineers, who are increasingly focused on developing innovative materials and techniques to enhance thermal efficiency. Intelligent and sustainable design plays a pivotal role in reducing energy consumption, contributing to the decarbonization of human activities and mitigating climate change.
In parallel, the reuse of construction and demolition waste (CDW) and of recycled polymers in building materials has become an essential strategy to minimize environmental impact while improving material properties. This approach ensures thermal and hygrometric comfort, promotes energy savings, and supports circular economy principles.
This experimental study investigates cementitious mixtures through two complementary strategies: (i) partial replacement of Portland cement with supplementary cementitious materials (SCMs), specifically natural pozzolan, and (ii) substitution of natural aggregates with lightweight aggregates (LWAs), including polymer waste and selected CDW. Several mix designs were prepared, starting with a reference specimen without any substitution, followed by mixes incorporating Aerated Autoclaved Concrete waste and rubber aggregates from End-of-Life Tires (ELTs) as sand replacements. Substitution ratios ranged from 0% to 100% by volume, enabling the development of innovative and eco-friendly mortar composites.
Thermophysical performance was assessed experimentally through thermal conductivity and thermal diffusivity measurements. The experimental setup for thermal diffusivity testing included a 1 kW halogen lamp and an Avio 550 infrared thermal imaging camera, ensuring accurate monitoring of temperature evolution during heating.
Results demonstrated the feasibility of incorporating up to 100% AAC waste by volume for mortar production. Significant improvements in thermal insulation were observed in mortars containing AAC and ELT rubber. Specifically, a 35% volume substitution of natural pozzolan for traditional binder was identified as the optimal incorporation rate for designing eco-efficient mortars. Furthermore, natural aggregates can be replaced up to 100% by volume with AAC or ELT rubber, or a combination thereof. In these cases, thermal conductivity decreased by approximately 50%, while thermal diffusivity dropped by about 60%. Conversely, binder replacement alone produced only marginal improvements, whereas aggregate substitution proved highly effective in enhancing thermal performance.
Overall, these findings confirm that LWAs—particularly recycled waste materials—represent a promising strategy for producing thermally insulating mortars with low environmental impact at an industrial scale. SCMs, while beneficial for sustainability, have limited influence on thermal properties compared to aggregate substitution. This research highlights the potential of combining waste reuse with advanced material design to improve building energy efficiency, reduce carbon footprint, and support sustainable construction practices.
This work describes the process of acquisition, validation, and visualization of geometric and thermal data obtained through LIDAR scanning of an industrial building. The study focuses on a warehouse representative of the catalogued constructions conforming the campus of the University of Castilla-La Mancha, located in the city of Toledo (Spain). The construction is a former Weapons Factory from the late XIX century, now used as a space for academic events. The objective was to create a digital model that would allow the extraction of surface temperatures from the various construction elements, facilitating their use in subsequent CFD or energy performance analyses inside the building.
The building, composed of brick masonry walls, a metal structural frame, and large glazed façades and skylights, forms a large-volume interior space with significant temperature differences between the lower and upper zones. As initial information, in this case, a detailed BIM model previously generated in .IFC format was available.
Geometric and Thermal Data collection was carried out using a LIDAR sensor on one of the hottest days of July. Simultaneously, ambient, indoor, outdoor, and surface temperatures were monitored at several locations to compare and validate the thermographic data. An application programmed in MATLAB was developed to enable interactive visualization and consultation of thermal data from the point cloud generated by the scanner. Subsequently, an algorithm was implemented to semi‑automatically assign a temperature value (obtained from the point cloud) to each construction element of the BIM model.
This work demonstrates the effectiveness of the method in providing reliable and easily accessible data, enabling more accurate building performance simulations for future rehabilitation or conditioning of the space.
Lymphedema is a chronic disorder of the lymphatic system characterized by the accumulation of interstitial fluid in soft tissues. Clinical signs such as swelling, fibro-adipose tissue accumulation, and skin thickening often manifest at advanced stages, making early detection essential to prevent irreversible tissue changes and functional impairment.
Various diagnostic methods are currently available to assess lymphatic function and tissue status, each with distinct advantages and limitations. Lymphoscintigraphy remains the gold standard for functional imaging of lymphatic transport. It relies on subcutaneous injection of radiolabeled tracers (typically 99mTc-labeled colloids) and gamma camera imaging to monitor tracer uptake and clearance. To overcome some of these limitations, indocyanine green (ICG) fluorescence lymphography has gained popularity. ICG is injected intradermally and visualized in real time using near-infrared (NIR) cameras, offering high-resolution imaging of superficial lymphatic vessels. Magnetic resonance lymphangiography (MRL) offers high-resolution, non-radioactive imaging of both superficial and deep lymphatic anatomy. It has been increasingly used to map lymphatic networks and detect anatomical anomalies, especially in primary lymphedema. Non-imaging techniques such as bioimpedance spectroscopy (BIS) provide an indirect measure of extracellular fluid content by analyzing the tissue’s electrical resistance. Complementary methods such as perometry and water displacement volumetry are commonly used for monitoring limb swelling over time. Ultrasound has also been applied to assess dermal and subdermal changes in tissue architecture, such as fluid accumulation or fibrosis.
Nevertheless, there is a significant gap in the current diagnostic landscape for Lymphedema. While some existing techniques listed above qualify as highly informative, they are either invasive, require expensive infrastructure, or offer limited functional information. As such, there remains a clear clinical need for a method that combines non-invasiveness, portability, depth sensitivity, and functional insight.
A novel diagnostic method for lymphedema that may prove particularly sensitive to accumulation of interstitial fluid in soft tissues is based on a combined technique known as Active Microwave Thermography (AMT). AMT was first introduced as a nondestructive testing (NDT) approach for civil and aerospace applications, amongst others. The premise behind AMT has a foundation in thermography, a well-known and well-established NDT technique, which has also been peripherally utilized in the medical field through the use of NIR cameras (mentioned previously). What is unique to AMT is the manner by which the thermal excitation is achieved – via absorption of high frequency non-ionizing electromagnetic energy. AMT has strong potential to serve as an additional diagnostic tool for medical applications, offering a noninvasive, noncontact, and portable approach capable of providing quantified diagnostic outcomes
This contribution will present our first and latest results in investigating AMT as a novel diagnostic tool for lymphedema. In particular, we will present a skin phantom tailored to the requirements of in-vitro AMT experiments. We select suitable materials, characterize the relevant electromagnetic and thermal properties, and combine them into a skin phantom. We will support the design with multi-physics simulation and provide first measurement results.
Active thermography is a non-destructive inspection technique widely used for various structures such as automobiles, aircrafts, and buildings. Although this is a convenient and non-contact inspection method, one practical limitation is that its inspection area is restricted by the heated area (or the size of the heat source); thus, its inspection efficiency cannot be sufficient when applying this method to large-sized objects. Large-area inspections typically require a large-sized heat source or multiple inspections with changing the heating area. To improve the efficiency and accuracy of active thermography inspection for large-sized objects, this study focuses on an inspection method with periodically scanning the heat source. In this method, a heat source is continuously scanned to expand the heating/inspecting area. In addition, to enhance inspection capability, we attempted to use "periodic" scanning of the heat source and phase image transformation of the thermal data. The periodic scanning induces periodic temperature changes on the heated surface. Subsequently, the temperature change (temperature–time data) is transformed to phase data using Fourier transform. The non-destructive inspection technique using the phase data (or phase images) is well-known as lock-in thermography technique and demonstrates higher inspection capabilities than the thermal-image-based inspection. Therefore, in the current study, using phase data at the same frequency as the scanning cycle should improve inspection capability. Experiments for a large-sized carbon fiber reinforced plastic (CFRP) specimen with artificial defects were performed. The specimen was heated using a scanning halogen line heater and surface temperature during heating was monitored by an infrared camera. The experimental results showed that the entire area of the specimen was periodically heated. Furthermore, defect detection capability in the phase image at the same frequency as the scanning frequency (obtained by applying Fourie transformation to the thermal data) was improved than that in the raw thermal images. In addition, the experimentally observed phase contrasts in the defective regions were compared with the theoretical phase contrasts calculated based on the theory of lock-in or pulse phase thermography method. The experimental results were well agreed with the theoretically estimated phase contrasts. These results show that the proposed method is effective for applying lock-in thermography inspection for large areas and thus it is promising for efficient inspection technique for large-sized structures.
The detection of subsurface defects in aluminum plates using infrared thermography addresses particularly stringent safety requirements in various industrial sectors, notably in civil aerospace construction and the automotive industry, where material reliability is a critical criterion. Such defects generally manifest as anomalies affecting both dimensional accuracy and geometric shape conformity.
The present work constitutes a contribution to the implementation of the thermal flash method in reflection mode, applied to the detection and thermophysical characterization of subsurface defects in aluminum plates. To this end, an experimental setup was designed and developed, incorporating a high-resolution infrared imaging system. This system enables the acquisition of thermogram sequences in the form of thermal images, representing the thermal state of the surface of the tested plate. Artificial subsurface defects of various geometric shapes and depths were intentionally introduced to evaluate the detection capability of the described method. Indeed, the use of advanced infrared image segmentation methods enables the estimation of local physical quantities characterizing each detected defect region, such as local thermal diffusivity, thermal contrast, the thermal barycenter, as well as the area and circularity of the defect surface. The obtained results are very encouraging and indicate the feasibility of developing a reliable system for the detection and characterization of subsurface defects in metal sheets.
In fusion devices, infrared thermography is extensively used to monitor surface temperatures ranging from 100 to 3600°C. However, interpreting infrared measurements in reflective metallic environments, such as those found in fusion devices, presents significant challenges. These complexities often result in temperature measurement errors on critical components, posing operational risks. To address these issues, we have developed an infrared image simulation tool based on the Monte Carlo Ray Tracing method. This tool is capable of simulating intricate thermal scenes, including detailed 3D geometries characterized by complex optical properties. Nevertheless, the primary limitation of the Monte Carlo method is the extensive sampling required to obtain usable images. This can escalate to billions of rays for a single image of 512x640 pixels, inevitably increasing computational costs.
Our recent advancements have focused on accelerating the code by leveraging NVIDIA GPU's RT-core technology to enhance efficiency and reduce computational time. This technology able to compute in hardware the ray-triangle intersection as well as the Bounding Volume Hierarchy (BVH) acceleration structure traversal, which involves dividing the scene into multiple sub-regions, creating a tree-like graph. This allows rays to traverse the structure and interact only with relevant triangles in the 3D scene, rather than comparing with all triangles, both significantly optimizing the ray-tracing process. When applied to a thermal scene in fusion devices comprising 1 million triangles, the simulation of a 512x640 pixel infrared image with 1 billion rays shows a remarkable improvement of 450 times. The simulation now takes just 5 seconds on an NVIDIA A40 GPU, compared to 32 minutes on a 48-thread Intel processor. Such performance is crucial for generating large synthetic databases used for training machine learning algorithms.
This new simulation has been integrated into CIVA, a widely-used software for simulation and analysis in Non-Destructive Testing (NDT), both in industry and research. This integration enables near real-time analysis of experimental data by varying different parameters such as temperature, emissivity, reflection models, and camera settings. It also facilitates the discrimination of false hot spots caused by reflection patterns or the underestimation of temperature due to changes in emissivity, which can pose operational risks. In further applications, these simulations have been used to build inverse models for estimating thermal scene parameters, such as temperature and emissivity, from infrared images.
This paper reports the advances of a study concerning an instrumental technique used to assess pain. Pain is a debilitating condition affecting about 20% of adults in the world. It can be considered as a warning mechanism or the response of human body to alert about a harmful state. It involves complex neuronal processes and it is considered as a personal experience with a relevant subjective component. In specific conditions, pain can be so debilitating that it alters feelings and attitudes. So, pain has important physical, psychological and social consequences and it can affect the quality of life. In absence of suitable and prompt treatments, the immune system can be compromised and pain sensation can interfere with the person ability to eat, concentrate, sleep, or interact with others. Consequently, the prompt and accurate pain assessment is essential for expediting therapeutic administration. Algologists operate in absence of standard objective detection tools for pain assessment. The gold standard for its assessment is today the patients’ self-report. So it is clear the need to define new objective assessing tools.
The proposed FITI-PAIN technique aims to propose the Functional Infrared Thermal Imaging for investigating the role of microvascular perfusion in pain sensation as promising biosignal and biomarker for pain assessment. Sympathetic nervous system plays an important role in regulating microvascular perfusion during pain sensation. The authors propose the infrared thermal imaging to characterize the role of microvascular blood flow in pain mechanism. Skin temperature signal of the body part affected from pain is recorded by a thermal camera and processed to evaluate the heat exchange between the blood flowing in the microvessels and the skin surface.
Cold pressor test and painful stimuli by using a Wartenberg pinwheel have been used as pain triggering events to evoke pain in volunteers. Data related to the perfusion signal have allowed us to extract information on the sympathetic nervous system involvement in the pain mechanism. The study has shown clear alterations of microvascular perfusion during pain sensation. Such alterations are strictly related to physiological processes such as: the constriction or relaxation of vascular smooth cells; the involvement of the sympathetic nervous system; the shape changes of endothelial cells in the vessel wall as a response to haemodynamic cues; and the respiratory and cardiac activities. The strict relation between the pain mechanism and the above processes could provide significant information to measure pain in the next future.
Seepage is a critical concern in earthen dams, often leading to internal erosion, piping, and potential structural failure if not detected at early stages. Conventional monitoring approaches, such as visual inspection and piezometer measurements, are limited by sparse spatial coverage and a lack of real-time capability. This study proposes a robust and automated framework that integrates infrared (IR) thermography with a dual-input convolutional neural network (CNN) to enable accurate, scalable, and near real-time seepage detection.
The dataset used in this study consists of approximately 500 paired optical and infrared images acquired from controlled laboratory-scale seepage experiments under varying hydraulic and environmental conditions. Each observation includes a co-registered pair of RGB optical images capturing surface texture and structural features, and IR thermograms capturing temperature distributions associated with subsurface moisture movement. The dataset is annotated into two classes: 300 seepage and 200 non-seepage samples. To ensure unbiased evaluation and generalization, the dataset was split into 80% training (400 images) and 20% testing (100 images), maintaining class balance. The IR images exhibit strong diurnal thermal variability, where seepage zones appear as low-temperature anomalies during morning due to evaporative cooling, and as high-temperature anomalies during evening due to thermal inertia. This variability necessitated adaptive preprocessing and labeling strategies.
A comprehensive preprocessing pipeline was implemented, including noise filtering, intensity normalization, and spatial smoothing to reduce sensor noise and environmental artifacts. For enhanced feature separability, clustering-based segmentation using K-means (k = 4) was applied to pixel-level thermal data. The optimal clustering configuration was validated using the Elbow Method and Silhouette Score. Automated cluster labeling was performed based on relative thermal statistics, enabling consistent identification of cold and hot seepage zones.
The processed IR images, along with corresponding optical images, were fed into a dual-input CNN architecture comprising parallel convolutional branches for thermal and spatial feature extraction. The extracted features were concatenated and passed through fully connected layers for binary classification. The network incorporated ReLU activation, batch normalization, and dropout regularization to improve convergence and prevent overfitting. The proposed framework achieved an overall accuracy of 91% on the test dataset. Class-wise evaluation showed a precision of 0.90, a recall of 0.95, and an F1-score of 0.93 for seepage detection, indicating high sensitivity and reliability, while the non-seepage class achieved an F1-score of 0.88. The confusion matrix confirmed minimal false negatives, which is critical for safety-critical applications.
Overall, the integration of advanced preprocessing, structured dataset design, and dual-modal deep learning significantly improves the robustness and accuracy of seepage detection. The framework demonstrates strong potential for real-time deployment and can be extended to UAV-based monitoring systems for large-scale dam health assessment.
Breast infrared thermography is a non-invasive imaging technique capable of capturing superficial temperature distributions associated with variations in metabolic and vascular activity, offering potential support for early breast cancer screening. However, variations in acquisition conditions, patient morphology, and temperature ranges across sessions introduce significant inconsistencies in the RGB color mapping of thermographic images, limiting their quantitative comparability and subsequent automated analysis. This study presents a comparative evaluation of three families of Deep Learning models: (i) Generative Adversarial Networks (GANs), (ii) Convolutional Neural Networks (CNNs), and (iii) Transformer-based architectures for RGB color normalization of breast thermographic images. The objective is to achieve a standardized color representation while preserving the underlying thermal information encoded in the temperature matrix. The proposed methods are quantitatively assessed using objective metrics related to color similarity, thermal reconstruction accuracy, and preservation of diagnostically relevant thermal patterns. Particular attention is given to minimizing color distortion without compromising spatial and thermal detail critical for infrared image interpretation. The results aim to identify the most suitable Deep Learning paradigm for color normalization in breast thermography and to provide practical recommendations for quantitative infrared imaging workflows, supporting downstream tasks such as segmentation, classification, and longitudinal thermal analysis in both clinical and research contexts.
Eddy Current Thermography (ECT) has emerged as a powerful technique in industrial environments for detecting surface breaking cracks, offering a highly automatable alternative to traditional inspection methods such as fluorescent magnetic particle testing or liquid penetrant inspection. Unlike these conventional techniques, ECT provides a high level of detectability and lends itself well to automation, making it attractive for modern quality assurance processes.
The true potential of ECT becomes evident when applying frequency resolved analysis methods, such as lock in amplification or Fourier analysis. These approaches exploit the characteristic and highly recognizable patterns that appear when analyzing the phase of thermal oscillations. In the case of short surface breaking cracks, a distinct multilobed pattern typically emerges, also known as ‘Butterfly Pattern’, enabling inspectors to identify and locate defects. Moreover, the orientation of the lobes correlates with the orientation of the crack, allowing experimenters to intuitively estimate its direction with relative ease. These inherent patterns make ECT particularly well suited for AI enabled automatic detection, opening the door to advanced fully automated inspection systems in the near future.
In previous work, we demonstrated that modifying the orientation of induced currents during thermographic testing can significantly enhance defect detectability. When the current direction is rotated, the multilobed pattern rotates synchronously, while the background remains largely unaffected. This behavior allows the current orientation to be treated as a phase parameter, enabling the combination of multiple complex images into a single enhanced image through a weighted summation similar to the optical phase shifting (PS) technique widely used in interferometry.
In this contribution, we propose viewing the multilobed pattern as a vortex like field interacting with a background. By applying PS, we effectively remove the background and isolate the vortex-like structure. Furthermore, using cross correlation with an appropriate vortex containing basis, we enhance defect visibility even further, producing a “dark field” image where only the features of interest remain. This approach not only improves clarity but also facilitates interpretation and has the potential to enhance automated defect detection. The methodology was validated using both artificial and real defects, demonstrating its applicability to practical industrial scenarios where reliable crack detection is critical.
Heat pipes have become key thermal management solutions for a wide range of applications where efficient and passive heat transfer is required. They are widely used in electronic cooling systems, such as computer processors and power electronics, as well as in aerospace and satellite systems, where reliability and compactness are critical. Among the different types, loop heat pipes (LHPs) are particularly attractive due to their ability to transport heat over long distances, operate against gravity, and provide high thermal performance without moving parts.
LHPs are commonly employed in space and aeronautical applications for the cooling of electronic equipment, where space constraints, weight limitations, and high heat fluxes impose stringent design requirements. Their main advantages include high effective thermal conductivity and robust operation under varying thermal loads and orientations.
In this context, the von Karman Institute (VKI) is involved in the LHP4ebox project, funded by the Skywin programme, which aims to develop a new generation of loop heat pipes integrated directly into the core of electronic equipment, using additively manufactured porous materials in the evaporator section. These advanced porous structures are expected to enhance capillary performance and improve heat transfer capabilities, while minimizing space requirements.
One aspect that remains largely unexplored is the influence of acceleration on LHP performance. In aeronautical environments, accelerations of up to several times the gravitational acceleration can occur, potentially affecting the distribution of liquid and vapor phases within the heat pipe and, consequently, its thermal behavior.
To address this challenge, the project will develop a dedicated experimental setup capable of reproducing acceleration levels representative of aeronautical conditions (up to 2g). A key feature of this setup is the integration of infrared thermography. While the most used measurement technique for such systems mostly consists in pointwise measurements using thermocouples, infrared imaging enables non-intrusive, spatially and temporally resolved measurements of surface temperature fields, providing indirect but valuable insight into phase distribution and flow regimes within the heat pipe. Its application has already demonstrated strong potential in the study of pulsating heat pipes. In this work, existing infrared methodologies developed for loop heat pipes will be adapted to consider the porous structures in the evaporator, enabling enhanced characterization of phase distribution.
The combination of controlled acceleration testing and high-resolution infrared thermography is expected to provide a deeper understanding of LHP operation under realistic conditions, ultimately supporting the development of more robust and efficient thermal management solutions for aeronautical applications.
This study investigates the propagation velocity of thermal waves, which is fundamental knowledge for improving the efficiency of active thermography inspections. The velocity of the thermal waves has been studied and described in many publications; the velocity vp is obtained as the square root of 2αω (α and ω are thermal diffusivity and angular frequency, respectively). However, this velocity is considered as the phase velocity in general wave theory, and the thermal energy (or wave packet) should propagate at the group velocity vg. Based on the wave theory of group velocity, the authors calculate the group velocity of thermal waves and estimated that the vg equals 2vp. To verify this estimation, experiments to observe the group velocities of thermal waves were performed. In the experiments, bar-shaped specimens made from three different materials (aluminum, stainless steel, and acrylic resin) were used. One end of the specimens was periodically heated using a halogen lamp to generate thermal waves propagating along the bar-shaped specimen one-dimensionally, and temperature change in the side surface of the specimen was observed by an infrared camera. The temperature–time relationships on the side surface were observed at multiple points, and the propagation velocities of the thermal waves were obtained from the relationship between the time delay in temperature change and the distance between the measurement points. In order to observe the propagation velocity of input thermal wave packets, which should be the group velocity vg, several post-processing steps (such as bandpass filtering and cross-correlation processing) were applied to the temperature data. The experimental results on aluminum specimens showed that the observed the propagation velocities obtained after the post-processing procedures agreed with the theoretically estimated group velocity (vg = 2vp). This demonstrates the validity of the theoretical estimation and implies the existence of group velocity in thermal waves. On the other hand, observation of the group velocities in the stainless steels and acrylic resins was difficult. This should be caused by the difference in amplitude attenuation; the attenuation of thermal waves propagating in stainless steel and acrylic is much greater than that in aluminum. Based on these results, the conditions under which group velocity is observable (which should be determined by the thermal properties of the material and temperature resolution of the infrared camera used) will be discussed in the conference.
Here we present a case study where it is used as a methodology for the evaluation of biomedical infrared imaging (BM-IRIm), as an aiding tool for the early diagnosis of diabetic neuropathy and diabetic foot syndrome (DFS). Considering that, DFS implies a group of anatomical and functional comorbidities expressed at the feet of diabetic people. Its principal characteristic parameters are: (1) the presence of diabetic peripheral neuropathy (DPN) and (2) peripheral arterial disease (PAD). Both are present in conditions of mixed peripheral damage, being (2) the most common case. The methodology presented here allows us to discern when peripheral damage is predominantly neuropathic or not. This enables guidelines for dealing with patients in a more personalized manner, and thus to forecast better options for treatment; additional benefits are the relatively lower cost and its potential to be a test performed as part of the clinical diagnosis. The case study relates to a couple of female patients with long-standing DM2 (more than five years) with no apparent expressions of DPN. The task is to extract information about their metabolic behavior governed by functional patterns associated with diabetic peripheral neuropathy. The results demonstrated a rather effective mismatch diagnostic concordance between clinical examinations and quantitative data obtained from analyzing the natural limbs asymmetry. The quantitative performance is expressed through a so-called asymmetrical thermal response index (ATR) and through the statistical thermal response index (TRI). The results are placed in contrast with two random controls exhibiting similar age, gender and general phenotype. Out of the current findings, one can raise the expectation of combining those indices to work out as effective and adaptable tools for detecting subtle information, otherwise hidden among radiometric data; such information is vital in facilitating timely interventions to prevent advanced stages of the diabetic foot disease, such as harmful ulcers; and if so, then ameliorate, and even eliminate, the risk of amputations.
Frozen foods are a sustainable, cost-effective, and convenient source of food with a global industry worth over USD 300 billion. Freezing food extends self-life, but the growth of large ice crystals can damage the food, impacting texture and taste. The process of freezing consists of two distinct phases: ice nucleation, the formation of an ice nucleus initiating freezing, and ice growth, the propagation of ice from the ice nucleus throughout the sample. Within the frozen food industry, faster freezing methods are generally preferred on the basis that the size of the ice crystals will be limited. However, data supporting this methodology has largely focused on indirect measurements such as food quality after freezing as opposed to the study of the ice itself. Additionally, faster cooling rates and methods can be more energy-inefficient and costly, requiring specialized materials such as liquid nitrogen.
Quantitative measurements of ice formation in whole-food samples are limited, in large part, by the difficulty of study in a complex matrix. This has left large gaps in the knowledge of ice nucleation and ice growth rates in foods, limiting the optimization of efficient freezing processes while preserving food quality. Typical methods for the study of ice nucleation and growth require the target material be in water or other transparent media to allow for appropriate visualization of the ice. We have employed high resolution infrared microthermography for the study of ice behavior in opaque samples, with beef being the primary target of study. The release of latent heat during freezing makes infrared thermography a suitable method for the study of the freezing process as the whole ice crystal can be visualized within the sample. We have studied the nucleation rate of ice in supercooled samples and the growth velocity of ice crystals in beef across a range of temperatures. These studies allow for the correlation of ice growth velocity across the variable structures present in a whole meat sample (e.g. connective tissues, muscle tissue, and fat) as well as nucleation rates of ice within these various structures. Results from these studies will inform improved freezing strategies in industrial settings and support future studies of controlled freezing with interventions including ice nucleating agents and antifreeze proteins.
Thermographic monitoring is increasingly used to supervise welding, yet robust in-process quality assessment remains challenging because thermal signatures are highly dynamic and depend on interacting physical factors such as heat input, surface condition, emissivity variation, reflections, shielding, and viewing geometry. This paper presents an anomaly-detection workflow for infrared thermography (IRT) sequences recorded during TIG (Tungsten Inert Gas) welding. The goal is to detect atypical thermal behaviour early enough to support operator feedback, reduce scrap, and complement conventional post-process inspection.
A controlled experimental campaign was conducted in which a radiometric infrared camera observed the weld pool and adjacent heat-affected zone during bead-on-plate welding under diverse but representative operating conditions. Multiple materials and parameter settings were deliberately explored to capture natural variability of nominal runs as well as the types of transient disturbances that can appear during arc welding. Each thermographic recording was linked to the corresponding specimen and process metadata to ensure traceability between infrared data and the physical outcome.
The proposed pipeline begins with conversion of the radiometric stream into calibrated temperature maps and selection of a region of interest around the arc–pool area to suppress background effects. Normalization and temporal alignment are applied to make learning less sensitive to changes in absolute temperature level and to highlight structural thermal patterns. Alongside deep learning, the method computes interpretable indicators that serve as baselines and diagnostics, including the evolution of average temperature within the region of interest, inter-frame temperature changes, and the relative extent of high-temperature zones obtained with adaptive thresholding. These descriptors help characterize typical behaviour, identify sudden perturbations, and support curation of nominal data for model training.
For anomalies detection, a convolutional autoencoder is trained exclusively on thermograms representing stable, acceptable process behaviour. The network learns a compact representation of expected spatial temperature distributions and reconstructs incoming frames. During inference, reconstruction error provides an anomaly score: frames that cannot be well reconstructed are treated as potentially abnormal. To reduce false alarms caused by benign variability or optical artifacts, a lightweight post-verification step examines additional image cues (for example, geometry- and edge-related features) to confirm the deviation and provide a coarse qualitative categorization of the event.
Results on the recorded sequences show that peaks in reconstruction error align with visible thermal irregularities and indications of unstable bead formation. By combining physics-informed preprocessing, transparent thermal indicators, and unsupervised deep learning, the workflow offers a practical route toward scalable IR-based supervision of TIG welding in settings where labelled defect data are limited.
Ice swimming is a very demanding sports discipline requiring extraordinary body adaptation to harsh environmental conditions. The International Ice Swimming Association (IISA) rules require water temperature to be below 5 °C during the entire swimming session. Athletes cover distances from 100 m to as much as 6 km in these conditions without wetsuits or any additional warming elements spending anywhere from one minute to several hundred minutes in the cold water. During that time, the body cools down rapidly, causing the body temperature to drop, even to mild hypothermia levels. Considering such a sudden temperature drop, the body's thermoregulatory mechanisms should cause heat exchange reduction between proximal and distal regions of the body. The temperature difference between individual, selected body parts after the session might carry broad information about the thermoregulative behaviour of the body, allowing further enhancement and understanding of the swimmers’ performance. This paper proposes a method for ice swimmers’ physical condition assessment and time-in-the-water estimation based on the analysis of the thermograms recorded just before and after the swimming session as well as supplementary biomedical data such as heart rate and skin temperature, regardless of the individual traits of swimmers. Thermography, as a non-invasive, non-contact, and rapid method, enables the recording of skin temperature distribution across large areas of the body without interfering with natural physiological processes or impacting swimmers' comfort. Compared to traditional skin temperature measurements, thermography allows for the detection of local temperature gradients, temperature asymmetries, and differences between selected skin areas. Thermal imaging also allows for the identification of areas particularly susceptible to excessive cooling, which can be crucial for swimmers' safety. The proposed study demonstrates the potential of using thermal imaging for rapid and non-invasive diagnosis of whole-body temperature distribution in swimmers. This could contribute to better understanding of ice swimmers thermal adaptation and may contribute to determining a maximum time that can be spent in the water without a risk to health of the individual.
We propose to characterize materials with variable thermal properties by aiming a laser beam at a metal target in periodic motion. The intense heat flow from the laser is then dissipated by the movement of the target and can be observed and characterized by IR thermography (Figure 1). We will present the models and initial experiments in comparison with a stationary target. This type of study foreshadows the development of “thermal metamaterials” with apparent properties that can be adjusted according to the movement of the targets. The approach to metamaterials is highly developed in optics and acoustics [1-2], but to our knowledge, little has been done in heat transfer, especially experimentally [3-4]. This movement remains macroscopically stationary since it will be periodic. It paves the way for the design of new types of heat spreaders, such as thermal diodes.
Polymethacrylimide (PMI) foam is widely used in aerospace applications due to its lightweight, high strength, and excellent thermal protection performance. However, its low dielectric constant and closed-cell microstructure make internal debonding defects difficult to detect using conventional nondestructive testing methods. To address the need for defect characterization in thermal protection composites, infrared thermography was first employed to evaluate its response capability and applicability for internal defects. The results indicate that infrared thermography exhibits limited sensitivity to small debonding defects with heights ranging from 0.1 to 0.4 mm, making reliable internal localization challenging. To overcome this limitation, a microwave near-field reflection method based on an open-ended rectangular waveguide is proposed. A multilayer dielectric electromagnetic model is established to analyze the defect response mechanism, and key parameters, including probe distance, operating frequency, and scanning step size, are optimized through numerical simulations and experiments, enabling high-sensitivity and high-resolution detection of internal defects. In terms of image processing, anisotropic diffusion filtering is introduced to effectively suppress Rayleigh speckle noise while preserving defect edge features. Under optimized conditions, the developed automated inspection system is capable of stably imaging 16 artificial defects, and signal-to-noise ratio analysis demonstrates that the image quality is significantly superior to that obtained using mean and Gaussian filtering methods. The results demonstrate that the proposed microwave near-field method effectively compensates for the limitations of infrared thermography in detecting small internal defects, enabling comprehensive defect characterization of thermal protection composites and providing a potential approach for integrating rapid surface inspection with high-resolution internal imaging in hybrid nondestructive evaluation.
Accurate interpretation of building façades from thermal images is usually being achieved through a two-stage process, where façade layout parsing and fine-grained masonry material segmentation are carried out in sequence. Automated structural assessment, material mapping, and digital-twin generation are being enabled when these stages are completed in a reliable way, although in practice the results can depend on the dataset condition. Deep learning is generally regarded as the most effective framework for this purpose, since very high performance has been demonstrated in both pixel-level segmentation and object-level detection tasks, even if some models can behave a bit differently under varying illumination. In this article, foundational segmentation architectures such as U-Net and DeepLab are being taken into account, while state-of-the-art transformer-based models, including SegFormer , are also being considered because their capability for more global contextual reasoning has been shown.
For the detection of façade components like windows and doors, established object-detection methods—including Faster R-CNN and the YOLO family are being incorporated. When combined, these models are used for forming a practical and trainable pipeline that is compatible with MATLAB and Python environments for more comprehensive façade analysis, even if some additional tuning is usually needed. In general, accurate interpretation of building façades from thermal images is being understood as requiring these two main stages: façade layout parsing and fine-grained masonry material segmentation. Deep learning is therefore being viewed as the most robust approach, and the architectures that can be trained in MATLAB or Python are being summarised in this document together with a practical pipeline for their implementation.
Coal fracture intensity strongly controls coal mass quality and geomechanical stability. However, its assessment in situ is often limited by safety constraints that prevent the use of external heat sources. This study investigates the use of infrared thermography (IRT) combined with controlled water cooling as a non-destructive method to evaluate fracture development in coal without external heating. Coal samples with varying fracture densities were rapidly cooled by water exposure and their thermal recovery under ambient conditions was monitored using IRT. Analysis of time-dependent thermograms shows that more intensely fractured coal exhibits faster and more heterogeneous thermal recovery, reflecting enhanced heat transfer associated with fracture networks. Water cooling amplifies thermal contrasts between samples. A synthetic index was introduced to describe recovery behaviour independently of absolute boundary conditions. The results demonstrate the potential of water induced thermal recovery dynamics as a safe for assessing coal quality and fracture-controlled permeability.
Aerial optical fiber cables in telecommunications access networks are highly susceptible to damage from environmental factors such as strong winds and tree contact. Conventional fault localization relies on optical time-domain reflectometry to identify approximate fault sections, followed by visible light injection to pinpoint exact breakpoints through visual observation of light leakage. However, this approach fails when fibers break internally due to bending stress or lateral pressure while the external sheath remains intact, which is a frequently encountered scenario in field maintenance. This limitation has motivated the exploration of alternative diagnostic techniques capable of detecting internal faults non-destructively.
Infrared thermography offers a promising approach by detecting heat generated at fiber breakpoints. When optical signals propagate through a fiber with an internal break, light leaks from the damaged core and converts into thermal energy, producing localized heating at the cable surface. While our previous work utilizing steady-state thermography successfully demonstrated breakpoint localization without damaging the cable sheath, it required optical input power exceeding +3 dBm. This power level poses a critical practical limitation: since typical communication signals operate at 0 dBm or below, accidental injection into an operational fiber at such elevated power levels risks damaging active communication equipment. Reducing the required optical input power is therefore essential for safe field deployment.
As a solution, we propose applying lock-in thermography to this fiber fault diagnosis application to overcome the power limitation inherent in steady-state measurements. By injecting intensity-modulated laser light into the fiber, periodic heating occurs at the breakpoint, enabling high-sensitivity detection through synchronous thermal imaging. This approach extends the application of lock-in thermography to optical fiber infrastructure maintenance.
Our experimental setup utilized a 1550-nm Fabry-Perot laser diode modulated at frequencies of 0.1, 0.5, and 0.9 Hz, with maximum optical input power varied from –8 to 0 dBm. Drop cable samples (cross-section: 2.25 × 1.59 mm) with intentionally broken internal fibers and intact sheaths were imaged at 30 Hz for up to 120 seconds followed by temporal Fast Fourier Transform (FFT) processing for each pixel to extract the modulation frequency component.
While steady-state thermal imaging showed no discernible temperature increase even at 0 dBm input power, lock-in detection successfully revealed clear amplitude peaks at breakpoint locations. The lowest modulation frequency tested (0.1 Hz) proved optimal for this application, providing larger amplitude signals and wider detection range, as spatial resolution is less critical than detectability for fault localization. Extended measurement time progressively improved the signal-to-noise ratio.
Quantitative evaluation using region-of-interest analysis demonstrated that with a 60-second measurement time at 0.1-Hz modulation, breakpoints could be clearly identified at –2 dBm optical input power. This represents a reduction exceeding 5 dB compared to steady-state thermography requirements, bringing the detection threshold close to normal communication signal levels and substantially mitigating equipment damage risks during field diagnostics. These results demonstrate that lock-in thermography can be effectively applied to non-destructive optical fiber fault diagnosis in telecommunications infrastructure.
Abstract:
Carbon fiber reinforced polymer (CFRP) composites are widely used in aerospace, but manufacturing and in-service processes can introduce hidden defects that threaten structural safety. Infrared thermography [1] is suitable for large-area non-destructive testing, but it is affected by non-uniform heating and noise, making it difficult to reliably identify weak thermal anomalies. This paper proposes Long short-term memory Autoencoder Principal Component Thermography (LAPCT) to model the spatiotemporal information of thermal image sequences in an end-to-end manner. This method utilizes the temporal dynamic features of each pixel within the sequence as its core input. By maintaining complete spatial relationships at the pixel level, similar temporal modes of neighboring pixels can enhance each other, thereby providing spatial contextual support for weak dynamic signals. Simultaneously, low-dimensional temporal features focus on the dynamic trajectory of each single pixel, avoiding interference from irrelevant spatial information. By introducing optical flow consistency loss [2], inter-frame dynamic features are further enhanced. Principal component thermography (PCT) [3] is applied to the reconstructed sequence to extract discriminative features. This method significantly enhances defect characterization and improves contrast-to-noise ratio (CNR) on aerospace CFRP samples, achieving more robust automatic detection compared to the traditional PCT model.
Sample:
This study is based on a honeycomb sandwich CFRP specimen. It is used in the side panels and floor of aircraft cargo holds. The actual sample image is shown in Figure 1.
Figure 1. Experimental Sample Case
To simulate the leakage conditions of in-service components, holes in different diameters were drilled on the back of the specimen. Water and aviation oil were injected into these holes to simulate water and oil leakage scenarios. The experimental specimen dimensions were 24.5 cm × 15.8 cm × 1.0 cm. Hole diameters decreased sequentially from 1.3 cm to 1.0 cm, 0.8 cm, and 0.7 cm. Specific details are shown in Figure 2.
Figure 2. Defect Distribution Diagram
Significant references
1. Liu Y, Yao Y, Wang F, et al. Review of unsupervised machine learning methods in active infrared thermography for defect detection and analysis. Quantitative InfraRed Thermography Journal, DOI: 10.1080/17686733.2025.2592191.
2. Jonschkowski R, Stone A, Barron J T, et al. What matters in unsupervised optical flow. European conference on computer vision. Cham: Springer International Publishing, 2020: 557-572.
3. Fleuret J, Ebrahimi S, Castanedo C I, et al. On the use of pulsed thermography signal reconstruction based on linear support vector regression for carbon fiber reinforced polymer inspection. Quantitative InfraRed Thermography Journal, 2023, 20(2): 39-61.
Infrared thermography is becoming increasingly popular in animal production, favoring non-invasive techniques for monitoring animal health and welfare. In dairy cattle, hoof diseases and lameness represent a major health and welfare concern, leading to reduced productivity and increased treatment costs. The application of infrared thermography offers a promising approach for the early detection of such conditions. According to our experiences and the experiences of other authors, sick cows’ hooves have a significantly higher temperature than healthy hooves.
The aim of this paper is to present the possibilities of applying thermography in farm conditions but also to present some of the challenges of their application. The studies were conducted on commercial dairy farms. Infrared thermographic images of the hooves were obtained using a stationary thermal camera under farm conditions. Surface temperature values were recorded at predefined regions of interest on each hoof. Based on the analysis of the thermal records and evaluation of the cow’s lameness score, the selection of cows was made for further examination. With the selection and examination of the suspected cows, we had the aim of early detection of the disease and prevention of lameness. The results were different, but still with a fairly high percentage of accuracy in the assessment, of at least 75% and above accuracy in selecting suspicious cows. While there is considerable potential, challenges remain, such as the farm differences, difficulties with animal identification, contamination of the hooves with impurities from urine and feces, splashing with water by farm workers, etc.
In conclusion, infrared thermography shows potential as a complementary diagnostic tool for the early identification and monitoring of hoof health, contributing to improved disease management and animal welfare on dairy farms. Further research is needed to develop optimal integration of different methods to improve the accuracy and efficiency of infrared thermography application and to find ways to overcome problems in practice.
This work focuses on the spatial and temporal characterization of two halogen lamps, measured experimentally using appropriate instrumentation: an infrared photodiode at the end of a robotic arm, and electrical current and voltage sensors placed across the terminals of the halogen lamp generator. The evaluation of the electrical power consumed, and the spatial and temporal distribution of the optical flux emitted by the lamps, allows for a systems-based modeling of the entire excitation chain. The electrical resistance of the tungsten filament, which depends on its temperature, is modeled analytically, and its mass and thermal inertia are also estimated through the generation of various waveforms (variable-frequency sinusoidal waves and square waves). Finally, an electrical and thermal transfer function associated with the generator and the tungsten filament of the lamps is proposed. The transfer function, a first-order low-pass type, demonstrates the limitation of halogen lamps in generating thermal frequencies higher than a few Hz. This work proposes a method for correcting these artifacts for applications involving the evaluation of thin materials or the characterization of the axial thermal diffusivity of materials. This offers prospects for achieving lighting with faster time constants.
Infrared cameras are widely used in scientific research and industrial applications for temperature measurement and thermal analysis. For quantitative purposes, it is essential to adopt an appropriate radiometric model that accurately represents both the measurement conditions and specific properties of the target object. The diffuse-gray body approximation is commonly used in conventional thermography and is often embedded in camera software. However, this simplification can lead to significant errors when spectral–directional effects are present, such as in temperature monitoring during machining processes, gas quantification, or the thermal analysis of photovoltaic systems. In contrast, the standard formulation to address radiative phenomena is the spectral–directional approach, which captures both angular and spectral dependencies and incorporates critical parameters such as the detector’s spectral response and the atmosphere’s spectral transmissivity. In this work, we simulate the radiance spectra reaching a Long-Wave Infrared (LWIR) camera detector for a given object temperature and emissivity distribution, and analyze the differences between spectral and diffuse-gray models in determining the object temperature through an inverse analysis. We simulated spectra for object temperatures of 300 K, 400 K, 500 K, 1000 K, and 1200 K, considering various emissivity functions randomly generated within the interval [0, 1], including continuously increasing and decreasing profiles. For each simulated scenario, we defined object, reflected, and atmospheric temperatures, along with the atmospheric spectral transmissivity and the detector response curve. Finally, we computed the object temperature using both the diffuse-gray and spectral models, then compared these results against the known temperatures of the original simulated scenarios. The results show that differences between the retrieved temperatures depend strongly on both the spectral behavior of emissivity and the object temperatures. Profiles with increasing and decreasing emissivity variation yielded larger deviations, reaching up to hundreds degrees Celsius. Moreover, the analysis revealed that these discrepancies are amplified at higher object temperatures and low-emissivity values, while for lower temperatures the differences between the models are less pronounced. Readers can benefit from this article, using it as a framework to check the reliability and the measurement deviations introduced by the diffuse-gray approximation across different target temperatures and emissivity distributions.
This study presents experimental results on non-stationary thermal and gas-dynamic processes emerging from the interaction of a plane shock wave (Mach 2.0–4.5) with axisymmetric blunt-cylinder models (sphere-blunted cylinder and a flat-nosed cylinder) in a shock tube channel.
The research employed combined high-speed optical and infrared diagnostics. Gas-dynamic structures were visualized using shadowgraphy through the channel's side windows (SiO₂) transparent to optical and infrared radiation. Non-stationary thermal fields on the model and channel surfaces were captured via panoramic thermography using Telops FAST M200.
The observed heated flow areas were: the flow behind plane shock wave (air); the flow behind bow shock wave; the flow behind contact surface (cold helium); the flow-wall interface (2 windows and the upper and lower walls); the axisymmetric model surfaces. Filters for different wavelength ranges were used to understand the radiation sources. Period of up to 100 ms post-interaction time was recorded.
A combined analysis of shadowgraph and thermographic data enabled the determination of characteristic times for various stages of non-stationary flow behind a plane shock wave and to investigation of the thermal processes accompanying the supersonic and subsonic flow regimes around the models.
The results demonstrate a direct correlation between gas flow evolution and thermal radiation intensity. For incident shock waves with M > 3, a supersonic flow regime with a detached bow shock wave persists for approximately 150 - 300 μs, transitioning to subsonic flow after 300-500 μs. Therefore, the maximum-recorded thermal radiation intensity from streamlined surfaces occurred within the first 500 μs, primarily in the boundary layer on the channel walls interacting with secondary shock structures and in the frontal stagnation zone of the models. Radiation from the heated quartz side windows decayed to background levels within 200-400 μs after shock diffraction. In contrast, the model surface exhibited prolonged cooling: thermal radiation from the nose region was detectable for up to 50 ms, and from the cylinder side surface for 30–40 ms (for M=3).
In summary, this work experimentally characterized thermal processes during non-stationary flow/body interaction. The application of synchronized shadowgraphy and thermography, complemented by advanced image processing, enabled the determination of characteristic flow regime timescales, identification of thermal emission regions linked to shock structures, and quantification of surface cooling dynamics.
Konstantin O. Petrosyants1, Igor A. Kharitonov1, Maksim V. Kozhukhov1, Aleksandr D. Pershin2
1 Moscow Institute of Electronics and Mathematics of
National Research University Higher School of Economics Moscow, Russia,
2 Limited Liability Company "InnoCenter VAO", Moscow, Russia
GaN solid state power amplifiers are important components for wireless power transfer in mobile communication base transceiver stations, radar systems, wireless charging devices and many other applications. The increase in power density in electronic devices has led to a large rise in heat flux, thereby requiring effective thermal management of them . To provide the GaN High Electron Mobility Transistor (HEMT) device junction temperature below 175…180◦C, it is important to realize an appropriate thermal analysis and management strategy.
he paper presents the results of thermal distribution measurements in GaN HEMT IC constructions and their application for their digital twins development.
Temperature measurements were carried out using a infrared Flir camera with 17 mkm macro Lenz at a constant room temperature and the different electrical biases: gate-source voltages Vgs, drain currents Id and dissipated powers Pdiss for the HEMTs.
The following solid state power amplifier chips were analyzed: one –stage amplifier IC chip with GaN HEMT (Pdiss=15 W), two-stage amplifier IC chips with the different circuit realizations and dissipated powers (Pdiss= 43W and 60 W). The channel length was 4 mkm for all the HEMTs.
The maximum temperature (Tmax) and thermal resistance (Rth) values of GaN HEMT were:
- for one –stage amplifiers IC chip - Tmax=74°C, Rth=2,11 °C/W;
- for two-stages amplifier IC chips - Tmax=110°C, (Pdiss= 43W), Rth=1,15 °C/W,
Tmax=170°C, (Pdiss= 62W), Rth=1,5 °C/W.
The maximal temperature value Tmax=170°C is not far from the higher temperature limit for GaN HEMT. So the recommendation was formulated to enhance cooling conditions for the chip with Tmax=170°C.
The IR measurement results mentioned above were used for electro-thermal TCAD and SPICE models development and calibration for further GaN IC chips more detailed investigations.
Thyroid cancer is a prevalent form of endocrine cancer that requires early diagnosis to optimize patient outcomes. Importantly, standard diagnostic procedures, such as fine-needle aspiration biopsy, may be invasive. For this reason, it is crucial to explore new technologies to detect this pathology. In this context, infrared thermography (IRT) is a non-invasive imaging method that may evaluate thermal abnormalities linked to diseased processes, such as neoplastic forms. In fact, the metabolic hyperactivity and abnormal vascularization characteristic of malignant thyroid nodules generate peculiar thermal patterns on the skin surface, which may be identified using deep learning (DL) algorithms. Moreover, using transfer learning methods, which use pre-trained models on large and general datasets, allows handling small datasets while still getting good classification accuracy.
The objective of this work was to create a two-class classifier for thyroid tumors (carcinoma vs adenoma) using IRT images by transfer learning with the VGG-16 architecture. In this study, a publicly accessible dataset (https://doi.org/10.3390/s21134459), consisting of thermal pictures from 97 patients (61 with adenoma and 36 with carcinoma), aged 25-75 years, acquired with a FLIR SC620 thermal camera (640×480 pixel resolution). The images were resized to 224×224 pixels and normalized into the [0,1] range. The dataset was split into 70% for training and validation (5-fold) and 30% for testing. Notably, the most numerous class was randomly undersampled to guarantee the balance between the two classes. The VGG-16 model was built with frozen convolutional layers to keep learned generic features. Classification layers were added, such as a global average pooling layer, a fully connected layer with 128 neurons and ReLU activation, a dropout layer (rate=0.5) for regularization, and a sigmoid output layer for binary classification. During training, data augmentation techniques were employed including rotation (±20°), width and height change (10%), shearing (10%), zoom change (20%), brightness change (0.9–1.1 range), and horizontal flipping of image. The model was compiled using the Adam optimizer and binary cross-entropy loss. This model was trained for up to 50 epochs with a batch size of 20. In order to avoid overfitting, an early stopping with a patience of 10 epochs and validation loss was employed. The model showed an overall accuracy of 93.2%, precision of 94.1% and recall of 92.3%. The results suggest that transfer learning with VGG-16 system might be able to efficiently identify the thermal patterns related to the thyroid tumors. The non-invasive nature of IRT combined with DL methods offers clinical potential as a large-scale screening tool, particularly useful in resource-limited areas or for patients requiring frequent monitoring. Further research including multi-centric investigations, using larger more diverse datasets and multimodal imaging approaches is indeed needed to enhance the diagnostic capability of the method.
The surface condition of stainless steel strongly influences corrosion resistance, aesthetics, and the need for post-weld cleaning. In particular, oxide formation during thermal processing modifies surface emissivity and radiative heat exchange, which can bias temperature readings and, at the same time, provide an opportunity for non-contact diagnostics. This work investigates the feasibility of determining the oxidation state of stainless-steel surfaces (oxidized vs. non-oxidized and intermediate conditions) during and after welding-like thermal loading using infrared thermography combined with digital image analysis.
An experimental setup is developed to reproduce a controlled welding scenario with a moving heat source and synchronized thermographic recording. During thermal excitation, the interaction between the heated zone and the surrounding atmosphere is modified by forced gas flow delivered near the heat-affected region. Three classes of process atmospheres are considered: (i) inert shielding gas, (ii) active gas mixtures, and (iii) oxidizing atmospheres, enabling controlled promotion or suppression of oxide formation both during the pass and in the cooling stage. Additionally, stainless-steel specimens with deliberately varied initial surface conditions, including mechanically cleaned surfaces, pre-oxidized surfaces, and surfaces with different roughness levels are used for post-process assessment development.
Thermographic sequences are analyzed in two complementary ways. First, transient thermal descriptors are extracted (e.g., heating/cooling rates, peak temperature evolution along the travel direction, spatial gradients near the heat-affected zone, and time constants derived from local cooling curves). Second, digital image-processing features are computed directly from the infrared imagery (texture and spatio-temporal pattern metrics, tracking of isotherm shapes, and statistical descriptors of emissivity-related contrast changes). These features are fused to classify the surface state and to localize regions with different oxidation levels in a map-based form. Where possible, the diagnostic procedure is designed to be robust to uncertainties in absolute emissivity by emphasizing relative, dynamic, and spatial signatures that arise from oxide growth and surface transformations.
The expected outcome is a thermography-driven methodology that enables in-process and post-process assessment of surface oxidation state without contact and without interrupting the welding operation. The study also aims to quantify how shielding conditions and initial surface preparation influence thermographic observables, and to outline practical guidelines for integrating such monitoring into welding and thermal-processing workflows. The proposed approach can support real-time quality control, reduce unnecessary post-weld treatment, and improve repeatability in applications where surface integrity of stainless steel is critical.
Cyclic fatigue is an important effect responsible for the service life of gas turbine engine blades. One of the implementations of the destructive effect is the thermoelastic effect that occurs in the blade material when the engine operation changes. In this case, a superposition of the heating field from the gas-plasma flow from the outside of the blade and the forced cooling field from the air flow directed through the internal channels of the blade blade occurs. It is the imperfections of the surface of the cooling channels that cause premature failure. To detect imperfections inside the cooling channels, a test stand was developed, which consisted of a Fluke 32 thermographic camera, a compressor for cooling the blades through the internal channels and various heating sources (electrothermal, thermal hair dryers, an ultrasound source). The study involved obtaining thermograms on the blade surface when it was heated by a reference wire placed in the cooling channels as a source of Joule heat. Thermograms were obtained in the mode of internal cooling - external heating with a heat dryer. Testing was carried out in the mode of heating with an ultrasound source. Estimates of the temperature increase at different frequencies of applied cyclic influences were made. The method of image clustering and methods of statistical processing of temperature field gradients were used to process thermographic data. The prospects of using thermographic test control for objects operated under conditions of vibration and cyclic temperature loading are shown.
In non-destructive testing (NDT), Flying-spot thermography has established itself as a reliable method for detecting surface-breaking cracks through local laser heating and infrared scanning. While effective, the automated analysis of these thermal sequences remains a significant challenge. The thermal signature of a crack—typically a high-frequency discontinuity in the thermal field—can be visually ambiguous, often resembling surface artifacts such as emissivity variations, non-planar geometries, or sensor noise. Consequently, the state of the art in automated thermographic analysis has shifted toward deep learning techniques, and predominantly Convolutional Neural Networks (CNNs) architecture, which are typically trained to detect and localize anomalies using large, task-specific annotated datasets.
However, standard CNN-based methods have some critical limitations in industrial NDT scenario. In a difficult task like segmentation, where the goal is to classify every pixel from an image, they are prone to overfit to local texture statistics rather than learning the semantic structure of a crack. This tendency results in poor generalization when applied to new experimental setups (e.g., different cameras or material surfaces). Furthermore, these models suffer from “catastrophic forgetting”: when fine-tuned on a new domain, they rapidly lose the ability to detect defects in the original domain, rendering them unsuitable for changing industrial environments, such as changes in sensing hardware, inspected materials, or inspection modalities.
In this work, we investigate the use of Foundation Models (FMs) for image segmentation across multiple thermal imaging scenarios. Foundation Models are deep neural networks pretrained on very large scale and highly diverse datasets, and designed to extract rich, high-level representations from images. Unlike conventional CNNs, which are typically pretrained on comparatively much smaller datasets (e.g., ImageNet) and which rely on local texture and contrast cues, FMs focus on global shape and structural information, making them inherently more robust to the high-frequency noise present in thermal imagery. We propose a segmentation framework in which a pretrained FM is used as the encoder and coupled with a lightweight decoder to generate segmentation masks. This approach is systematically compared to a standard CNN-based segmentation baseline across four evaluation settings: (i) in-domain performance, (ii) zero-shot generalization to unseen domains, (iii) transfer learning to new domains, and (iv) robustness to catastrophic forgetting after domain adaptation.
The proposed framework is evaluated on two flying-spot thermography datasets using Intersection-over-Union (IoU) and clDice, a topology-aware metric suited to thin crack structures. The results demonstrate three key advantages of our approach over a U-Net baseline. First, we achieve slightly higher segmentation accuracy in the source domain, effectively separating crack patterns from thermal artifacts. Secondly, during sequential domain adaptation, FMs exhibit strong robustness to catastrophic forgetting, retaining more than 80% of their original performance, whereas the CNN baseline collapses to near-zero accuracy. Finally, while zero-shot generalization remains challenging, FMs show improved robustness in unseen domains, detecting crack-like structures without the severe hallucinations observed in standard CNNs. These results indicate that FMs offer a promising approach for robust and label-efficient automated crack detection in industrial thermographic inspection.
Legendre Transform is a mathematical algorithm that maps a function defined in the linear space in another function defined in the dual space. The function in the dual space is generated by the original curve’s tangent and supporting line. Given the function y=f(x) in the space (x,y), its Legendre Transform is g=x·m-f(x), m=f´(x), that using x=(f´)⁻¹(m) can be mapped in the dual space (m,g(m)). Given the family of straight lines g= x·m-f(x), the function f=f(x) is the envelope curve of that family. The Legendre Transform is applicable only to convex functions (f´´(x)>0), but its extended version (Legendre-Fenchel) is applicable also to the non-convex one. The Fourier Transform, Laplace Transform and PCA, are well known in IR thermography. They are based on integral transformations that behave well against the noise of experimental data and are very useful in the reduction of dimensionality. On the contrary, the Legendre Transform is based on the derivative, and its tendency is that of amplify the noise of data and no easy way of reducing data dimensionality is devised. Nonetheless, there are at least a couple of reasons to experiment on the Legendre Transform applied to IR thermography data. The first is the growing interest of such a transformation in the field of image processing (e.g. Super-Resolution). The second relies on the alternative methods of solution of the heat conduction PDE, that is very often the base for thermographic analysis both in parameter estimation and in NDT. These alternative methods take advantage of the Lagrangian/Hamiltonian formalism that have been proposed for some computational advantage and, also for deeper insight of the physics underlining the processes. The Legendre Transform is well known in the frame of classical mechanics for being the transformation that brings the Lagrangian description to the Hamiltonian[S1.1] one, and back, thanks to its involutive nature. The aim of this paper is to investigate on the possible application/advantage (if any) of using the Legendre Transform in the field of IR thermography, with special attention on experiments dedicated to thermal parameter evaluation, and to Non-Destructive Testing for analysis/identification of buried defects in manufacts.
Ester D’Accardi, PhD is currently an RTD-A Researcher in Mechanical Design and Machine Construction at the Polytechnic University of Bari, where she also obtained her PhD in Mechanical and Management Engineering in 2020. Since the beginning of her PhD, her research has consistently focused on quantitative infrared thermography applied to non-destructive testing (NDT), process monitoring and material characterization. Her activity focuses on the development of experimental procedures and data analysis methods aimed at moving from qualitative defect detection to quantitative characterization, including defect sizing, depth estimation and probability of detection (POD) assessment. She has investigated fatigue crack characterization under realistic inspection conditions and the use of induction, conduction and laser thermography for industrial NDT scenarios. A significant part of her research concerns additive manufacturing, covering both online thermographic monitoring during fabrication and offline inspection for the process and material characterization, as well as detection and quantitative assessment of typical defects such as lack of fusion, keyhole defects and porosity. She collaborates with international institutions such as BAM, TU Leoben and A*STAR IMRE, recognized centers of excellence in thermography and materials research, as well as with industrial partners including Baker Hughes. Her scientific activity, consistently developed in the field of infrared thermography, is directed toward the definition of quantitative, experimentally validated procedures to support industrial non-destructive testing and process monitoring.
Laser-based additive manufacturing processes such as Laser Powder Bed Fusion (L-PBF) and Directed Energy Deposition (DED) are intrinsically governed by highly dynamic thermal conditions. Local heat accumulation, cooling rates and spatial temperature distributions directly influence defect formation, such as keyhole porosity and lack of fusion, as well as the resulting microstructure and mechanical performance. Thermal methods provide a complete and scalable approach to investigate these phenomena across di erent high di usive and fast materials, across aluminum alloys (AlSi10Mg), nickel-based superalloys (Inconel 718), super-duplex (F55) and more conventional steels (AISI 316L). During fabrication, in-situ infrared monitoring is based not on absolute temperature measurement, which is strongly a ected by emissivity uncertainties and melt pool evaluation, but on the extraction of robust thermal features. Parameters such as maximum apparent temperature, cooling slope, and statistical thermal features of reconstructed thermal fields are correlated with process parameters such as laser power, scanning speed, energy density and build position. This feature-based approach allows the identification of stable operating ranges of process parameters and the detection of conditions leading to defect formation, such as keyhole porosity or lack of fusion, without requiring complex emissivity calibration. The methodology has been demonstrated to be implementable with both cooled infrared cameras and microbolometric sensors, enabling robust and scalable industrial deployment. Offline, active thermographic testing adopts a similar feature-extraction strategy to detect and localize sub superficial real defects, typical of additive manufacturing processes. Laser thermography has been applied as active thermographic technique to inspect specimens with process-induced and artificial defects of real and complex geometry, validated by micro-computed tomography. Detection capability is analysed as a function of defect type, depth, morphology and material thermal di usivity. Particular attention is devoted to the quantitative characterization of clusters of keyhole porosity and lack-of-fusion regions, which produce distinct thermal signatures. Across on-line monitoring and o -line non-destructive evaluation, thermal feature extraction provides a versatile methodology applicable to di erent additive manufacturing processes, materials, defect types, and inspection conditions. The consistent use of measurable thermal descriptors enables a quantitative characterization of process parameter ranges, defect formation mechanisms, and their influence on resulting material microstructure and final mechanical performance. Thermal analysis thus becomes a practical tool for evaluating both process stability and material integrity in metal additive manufacturing.
Since about 10 years, Safran develops the use of active thermography for Non Destructive Inspection of aircraft and aerospace components. Initial applications were dedicated to composites parts, monolithic or sandwich, such as components for aircraft nacelles. The efficiency of the method lead Safran to investigate also the extension for application on metallic components.
Considering thermography is an emerging inspection method, Safran was faced with the fact that there was no existing standard and / or methodology available to check how the equipment behaves and make sure that production inspection is performed correctly.
Active thermography inspection for industrial applications requires the use of different component: infrared camera, excitation device, positioning and scanning system, information technology, dedicated reference test specimen,…
While integrating the inspection method for composites parts on the machine called IRIS, Safran defined the parameters to be checked on every single component and the associated periodicity. Some are checked daily internally with standard equipment. Some others require specific procedures and equipment, e.g. the use of external black bodies, and have to be performed externally by an accredited laboratory.
This paper will list the different periodical checks operated for all the components of our flash thermography machine. Some examples of results will be illustrated (evolution of camera cooling duration, flash energy deposit,…).
Current lacks in IRT standards and needs of representative reference samples will finally be discussed.
Various IR camera suppliers sell their products, regardless of their intended field of use and according to specifications that primarily address temperature measurement applications. For NDT applications by Infrared Thermography, users often select their cameras based on rather arbitrary criteria (wavelength range, acquisition frequency, temperature range, field of view) without taking into account the targeted application. Furthermore, cameras are generally delivered with temperature calibrations that are rarely utilized in NDT.
IR camera monitoring over time usually involves returning the device to the supplier for maintenance, where a few component checks are performed and NUC tables, bad pixel lists, and calibrations are updated according to the supplier’s own standards.
The rising use of IR cameras in production and maintenance inspections has highlighted the necessity to define calibration procedures that truly reflect industrial needs. This work presents Safran's ongoing efforts to monitor IR cameras, deploy an internal methodology, and eventually establish a dedicated standard.
Currently, specification requirements for NDT mainly rely on existing standards and user experience. However, the few available standards in Infrared Thermography often differ significantly in definitions and do not address operational conditions for camera characterization and validation. As a result, there is a need to clarify how to characterize an IR camera, define its application domain, and monitor its key parameters over time.
This study proposes a measurement methodology based on building SITF (Signal Intensity Transfer Function) curves using a HGH blackbody, allowing the estimation of critical features such as sensitivity, gain, NETD (Noise Equivalent Temperature Difference), measurement range, sensor correction, and bad pixel identification.
Even though the calculation of gain, offset looks straightforward, the process is influenced by different acquisitions conditions and processing parameters. Its even more tricky for sensitivity and NETD estimation since they are strongly linked to the setup of the camera, especially the integration time. Because existing standards lack guidance on operational conditions, camera characteristics are evaluated according to supplier recommendations.
Recognizing that NDT applications typically display intensity in Digital Levels (DL) instead of temperature, the paper introduces and discuss a new term, NEDLD (Noise Equivalent Digital Level Difference), more suitable than NETD.
Finally, the author will discuss in this paper how to determine this dynamic range and how to correct bad pixels in relation to specific applications.
Thermochromic liquid crystals (TLC) provide high spatial resolution surface thermography by mapping temperature to color. Quantitative use, however, requires robust calibration with the support of IR thermography, and careful control of optical artifacts. However, direct IR-referenced calibration in the final configuration is often impracticable in water-flow experiments where the surface is viewed through transmissive layers (e.g., water columns and polymer windows). Such layers can significantly attenuate thermal radiation in typical MWIR/LWIR bands, preventing reliable measurement of the true surface temperature behind the interface. In this work, we present a calibration-transfer procedure that enables re-use of an air-based TLC calibration in experimental configurations where imaging occurs through transmissive layers (water and plexiglass), which alter the recorded RGB intensities and therefore the computed hue.
A TLC coating (Hallcrest SPN300R27C18W, nominal red start 27 °C, bandwidth 18 °C) was applied to a curved rod bundle surface. Calibration was performed in air by simultaneously recording RGB images using a DSLR camera under white LED illumination and reference temperature maps using an infrared camera (FLIR A655sc) while the surface temperature was swept by controlled electrical heating. Hue values were computed from the RGB intensities of images, and mapped to temperature via pixel-wise calibration curves to account for spatial non-uniformity induced by surface curvature, viewing angle and geometry.
In our facility, the experiments have been performed in the Aupinel closed-loop water facility, featuring a vertical aluminum test section with plexiglass (PMMA) optical access and a hexagonal channel containing electrically heated rods.
The surface is observed through approximately 2 mm of water and a 1 cm plexiglass window, motivating a calibration-transfer approach from air to the water–plexiglass optical path. We propose a practical correction strategy based on per-channel multiplicative factors (kR, kG, kB) that compensate the recorded RGB values to an “equivalent air” response prior to hue extraction and temperature conversion. The correction factors are derived from a spectral model of the optical chain, by integrating the product of the TLC spectral respons, camera spectral sensitivities, and the wavelength-dependent transmissions of water and PMMA, following the Beer–Lambert law. In addition, specular reflections from the curved rods are mitigated using a two-polarizer arrangement to suppress polarized reflected components, improving hue stability in regions prone to glare.
A preliminary verification was performed to isolate plexiglass influence: identical scenes were recorded with and without the 1 cm plexiglass window, with exposure and white balance locked to the white LED source. After hue-to-temperature conversion, the resulting temperature difference map showed small discrepancies, with a maximum deviation of approximately 0.2 °C over the analyzed region. The validation is being extended to combine water+plexiglass optical paths, and to operating conditions representative of water-flow experiments.
This methodology enables quantitative TLC thermography in water-flow facilities where direct IR-referenced calibration is not feasible through water and polymer windows, by compensating spectral transmission effects and suppressing specular reflections.
In recent years, nanocomposites are gaining more and more attention from the industry. They found application in various fields, such as material manufacturing, engineering, transport, electronics, food and beverages, aerospace. However, the properties of the resulting nanocomposite are strongly dependent both on the type of nanoparticles added to the matrix and how they are dispersed in the matrix.
In this regard, it is well known that the level of dispersion of the nanoparticles in the polymer matrix is the parameter that, much more than others, can influence their enhancement capabilities. However, nanoparticle dispersion is widely recognised as a challenge in polymer nanocomposites fabrication. Moreover, quantifying dispersion at macroscopic level remains a difficult task.
Developing a quantitative measurement of dispersion is a challenge that involves systematically studying loading, particle size, agglomerates and interfacial interactions, where the microscopy remains as a gold standard but restricted to relatively small size samples. Therefore, it is essential to have low-cost non-destructive evaluations to control the quality of the products made, in order to guarantee compliance with their specifications.
In this work, a method for characterizing the dispersion of graphene-based nanocomposites focused on the use of pulsed thermography is presented, highlighting the advantages, challenges, and research future directions.
Abstract
The condition assessment of large-scale overhead timber components in ancient Chinese architecture — such as caisson ceilings (zaojing), bracket sets (dougong) and roof framing — is challenging because contact-based techniques (stress-wave timing, ultrasonic velocity, resistance drilling) are impractical for elements 5–8 m above floor level, while visible-light inspection is masked by centuries of grime, soot and oxidation. This work presents a lightweight, handheld dynamic thermal scanning protocol for rapid in-situ survey of inaccessible timber heritage. A 1 kW halogen spotlight is manually swept across the ceiling from ground level while an uncooled long-wave infrared (LWIR, 7.5–14 µm, 640×480, NETD 20 mK, 50 Hz) camera records the full thermal transient. Physically grounded thermal feature maps are extracted, including the temporal standard deviation of each pixel encoding surface thermal effusivity, a high-pass filtered version isolating material-intrinsic contrast, cooling-rate maps as a proxy for thermal diffusivity, and peak-arrival-time maps reconstructing the scan trajectory. The method is validated on the octagonal central caisson of the Main Hall of Baoguo Temple (1013 CE), revealing faded Song-dynasty floral scrollwork, wood knot and grain-orientation distributions, board-to-board joints, a grafted historical repair section, and localised anomalies indicative of biological degradation, all entirely invisible in the conventional visible-light photograph. The induced surface temperature rise is 1–2 °C, well below any damage threshold for aged timber.
Keywords: infrared thermography; dynamic thermal scanning; timber heritage; caisson ceiling; bracket set (dougong); thermal effusivity mapping; non-destructive evaluation; Song dynasty architecture; Baoguo Temple.
1. Introduction
Established non-destructive techniques for timber heritage — including stress-wave timing, ultrasonic velocity measurement and resistance drilling — require physical contact with or close proximity to the inspected surface, which is impractical for overhead components 5–8 m above floor level without scaffolding [1]. Visible-light inspection, although the most widely used, is severely constrained on millennium-old surfaces where accumulated grime, soot and oxidation products mask the underlying material characteristics and fade painted decorations to near-invisibility [2]. A rapid, non-contact and ground-based screening tool is therefore needed for periodic condition monitoring of large-scale, inaccessible timber heritage.
2. Experimental method
A 1 kW halogen spotlight is manually swept across the ceiling surface from ground level while an uncooled long-wave infrared (LWIR, 7.5–14 µm, 640×480, NETD 20 mK, 50 Hz) camera records the full thermal transient. The total equipment mass (camera, tripod, spotlight, cabling) is below 5 kg, and a full scan of one bay requires less than 60 s of acquisition. From the resulting spatiotemporal dataset, a suite of physically grounded thermal feature maps is extracted: (i) the temporal standard deviation of each pixel's temperature time series, encoding the spatial distribution of surface thermal effusivity; (ii) a spatial high-pass filtering of this standard-deviation field, which removes the slowly varying illumination envelope arising from handheld scanning and isolates material-intrinsic contrast from excitation artefacts; (iii) a cooling-rate map providing a qualitative proxy for thermal diffusivity; and (iv) a peak-arrival-time map that simultaneously reconstructs the scanning trajectory and encodes local thermal-inertia variations.
3. Results and discussion
The method is validated on the Main Hall of Baoguo Temple, Ningbo — a National Key Cultural Heritage Protection Unit housing one of the oldest surviving timber-framed structures in southern China (1013 CE) — focusing on the octagonal central caisson and the surrounding bracket-and-beam framework. Thermal scanning reveals a wealth of material-level information that is entirely invisible in the conventional visible-light photograph (Fig. 1): faded Song-dynasty floral scrollwork (juancaowen) and geometric motifs along the tie beams and in the corner bracket regions; spatial distributions of wood knots and grain orientation; board-to-board material differences at panel joints; a grafted historical repair section on an exposed load-bearing beam; and localised anomalies potentially indicative of biological degradation or moisture ingress (Fig. 2). The induced surface temperature rise of 1–2 °C above ambient is well below any damage threshold for aged timber, ensuring complete non-invasiveness [3, 4].
Fig. 1. Visible-light photograph of the octagonal caisson ceiling and surrounding bracket-and-beam framework in the Main Hall of Baoguo Temple (1013 CE), acquired from ground level at a working distance of approximately 6 m.
Fig. 2. High-pass filtered temporal standard deviation map of the same area obtained from a 60 s handheld thermal scan, revealing decorations, wood knots, grain orientation and localised anomalies.
4. Conclusion
A lightweight (<5 kg), handheld dynamic thermal scanning protocol is demonstrated for rapid in-situ inspection of inaccessible timber heritage. Combined with physically grounded thermal feature mapping, the protocol resolves faded painted decorations, hidden material heterogeneity and localised defects in a millennium-old caisson ceiling, all from ground level and within a 60 s acquisition. The proposed protocol therefore establishes a viable rapid-screening tool for periodic condition monitoring of large-scale, inaccessible timber heritage.
References
[1] Lin Y., Chun Q., Zhang C., et al., Research on seismic performance of traditional Chinese hall-style timber buildings in the Song and Yuan dynasties: a case study of the main hall of Baoguo Temple, J. Wood Sci., vol. 68, p. 1, 2022.
[2] Dritsa V., Orazi N., Yao Y., et al., Thermographic imaging in cultural heritage: a short review, Sensors, vol. 22, no. 23, p. 9076, 2022.
[3] Ding Y., Hu J., Sfarra S., et al., Fusion of infrared and terahertz imaging for non-invasive inspection of marqueteries coupled with finite element analyses, Infrared Phys. Technol., vol. 141, p. 105470, 2024.
[4] Ding Y., Russo G., Tshiangomba R.K., et al., Stabilization system for solar loading thermography applied on cultural heritage objects exposed outdoors, J. Therm. Anal. Calorim., vol. 150, pp. 1687–1707, 2025.
Soapstone (steatite) is widely documented as a quarried material; Alpine and Scandinavian contexts provide well-known examples in monuments, archaeological quarry landscapes, and utilitarian artefacts such as cookware. Its technological relevance derives from distinctive thermophysical properties, notably efficient heat transfer and rapid transient thermal response, which govern surface heat exchange. These properties affect processes of direct interest in cultural heritage, including moisture cycling and thermally induced stress fields, and may modulate near-surface microclimatic conditions in quarry environments. Quantitative characterization on real stone surfaces, in the laboratory and in situ, therefore requires non-invasive methods compatible with access constraints and heritage-preservation requirements. The workflow is applied in situ at the Caurga trench quarry (Parco del Paradiso, Chiavenna) and on oriented samples from Chiavenna Unit lithotypes, enabling direct laboratory–field comparison. Thermal diffusivity is measured within a quantitative infrared thermography framework using laser spot thermography in reflection. A portable low-power laser imposes a quasi-Gaussian circular heat input on a planar surface, and a radiometrically calibrated infrared camera with macro optics records the time-resolved two-dimensional temperature field during heating and subsequent cooling. Diffusivity is estimated by fitting the temporal evolution of spot spreading, quantified by the effective radius or spatial second moment, to analytical or numerical solutions of the two-dimensional heat equation. In-plane anisotropy is derived from directional analysis of the spot broadening, providing constraints on direction-dependent thermal transport. Repeatability and uncertainty are assessed through replicate acquisitions, radiometric calibration, and sensitivity analyses to emissivity assumptions and segmentation procedures. Moisture effects are investigated by IR thermography through the Spilling Drop Test (SDT). The thermal transient induced by a fixed-volume droplet is used to derive cooling-curve descriptors, and droplet segmentation and thresholding strategies are tested to ensure reproducibility across lithotypes and measurement conditions. SDT metrics are interpreted together with laser-based diffusivity and complementary material characterization, including X-ray diffraction, bulk density and water-accessible porosity from immersion methods, water imbibition capacity, specific heat, and ultrasonic P- and S-wave velocities with derived dynamic elastic moduli. Microclimatic implications are assessed by integrating lithotype-specific thermophysical parameters with near-surface temperature and humidity monitoring and local meteorological series. Surface energy exchange is interpreted using the Bowen ratio method. This combined approach supports site-scale characterization of soapstone thermal behavior in geoheritage and built heritage contexts.
A preliminary, purely numerical study is presented aimed at exploring the potential of a single-laser-spot thermography experiment for multi-parameter thermal characterization. The underlying idea is that localized continuous-wave laser excitation generates a temperature response whose different temporal regimes are governed by distinct physical mechanisms. In particular, the early transient following laser activation, the approach toward quasi-steady thermal conditions, and the subsequent relaxation after laser switch-off exhibit different dependencies on material thermal properties and heat-loss effects.
A three-dimensional finite-element heat transfer model is developed to simulate localized surface heating on a thin plate under realistic boundary conditions, including convective and radiative exchanges. Synthetic temperature fields 𝑇(𝑥,𝑦,𝑡) are generated and post-processed through representative observables typically available in infrared thermography measurements. The numerical results are used to qualitatively examine how different portions of the thermal response convey complementary information on thermal transport and energy storage phenomena, without prescribing a finalized measurement or inversion strategy at this stage.
This study provides preliminary numerical insights into the opportunities and limitations of single-test laser thermography for accessing multiple thermal descriptors within a single experiment. The results are intended to support the design of future experimental protocols and more detailed analyses, as well as potential extensions toward spatially resolved characterization of thermally affected regions.
In the context of climate change, reducing greenhouse gas emissions is necessary to achieve carbon neutrality by 2050. This requires action on several fronts: industrial decarbonisation, production of new heat sources, energy storage, solar fuel production, etc.
Solar fuels refer to molecules of interest synthesised using solar radiation as an energy source. These molecules are varied and include dihydrogen (H2), carbon monoxide (CO), syngas, ammonia (NH3), methane (CH4), etc. Solar thermochemistry is one of four ways to produce these solar fuels. It uses the heat provided by concentrated solar radiation to reach the high temperatures required for chemical reactions that are already known and understood, such as hydrocarbon cracking, methanation, and the dissociation of water (H2O) or carbon dioxide (CO2). Here we will focus on the process of producing green hydrogen through solar thermochemistry using a porous ceria (CeO₂) based exchanger. This ceramic allows green hydrogen to be produced by introducing water vapour (H2O) through a redox cycle (reduction at 900°C and oxydation at 1500°C) at low partial oxygen pressure Po2. However, prior knowledge of the thermophysical (thermal diffusivity) and radiative (normal spectral emissivity) properties of ceria allows to optimise its porous architecture in order to maximise the efficiency of the process.
In this work, an experimental setup for estimating the normal spectral emissivity of cerium at H2 production temperatures is first described. Next, the estimation methodology is developed and presented. Finally, the results obtained on a dense ceria sample are presented and discussed.
Monitoring of the absorption of microwaves in water-laden food is commonly established with thermal imaging, the potential of using thermography for visualizing electromagnetic concentration in resonant aqueous objects has largely been overlooked. Water exhibits a remarkably high refractive index on the order of n~9 at household microwave frequencies of 2.5 GHz. In these systems, the comparable wavelength-to-particle size ratio facilitates the trapping of electromagnetic waves, creating highly localized energy distributions, turning grape-sized water spheres into dielectric Mie resonators that are known to spark impressively in microwave ovens. A modest amount of absorption is advantageous as it generates a measurable thermal response without unduly disrupting the underlying resonant character. Consequently, the localized internal electric field patterns can then be captured as distinct temperature gradients. In this presentation, we introduce a novel methodology for visualizing these internal electromagnetic resonances using thermal imaging. We then show excellent comparison between simulated electric-filed mode maps and temperature distributions in isolated objects such as grapes and hydrogel beads at the fundamental magnetic dipole and electric dipole resonant sizes. Finally, we extend this approach to study mode evolution during sphere dimerization, showing how thermal patterns can be used as a reliable proxy for investigating complex photonic coupling effects. Ultimately, our approach provides a macroscopic tool for visualizing photonic effects that would be impossible to image in nanoparticle analogs.
Tungsten and tungsten-based alloy coatings are key candidates for plasma-facing components in fusion reactors due to their high melting point and favorable thermo-mechanical properties. However, their thermal performance is strongly influenced by microstructure, interfacial integrity, and processing-induced heterogeneities. Reliable, spatially resolved characterization of thermal properties and defect detection are essential for coating qualification.
This work presents a hybrid experimental-computational framework based on active infrared thermography (IRT) for tungsten and W-alloy coating characterization. Flash thermography with pulsed excitation and high-speed infrared imaging has been adapted to tungsten's high thermal conductivity regime. Large-area specimens with thickness gradients and compositional variations are being investigated.
A comprehensive dataset for machine learning training is being generated through three complementary approaches: (i) analytical heat transfer models for rapid generation of parametric defect libraries, (ii) finite element modeling (FEM) for realistic defect morphologies and complex geometries, and (iii) experimental thermographic measurements. AI models trained on transient thermal descriptors from these combined sources enable automated defect classification and thermal property mapping.
Initial results demonstrate detectability of interfacial debonding and distributed porosity in as-deposited coatings. This methodology establishes a scalable platform for plasma-exposed material assessment, providing quantitative thermal diffusivity maps and AI-assisted diagnostics for fusion coating development.
Active infrared thermography (IRT) is a contactless and non-intrusive technique for non-destructive evaluation, providing a fast means for locating and sizing subsurface defects in a wide range of materials. The virtual wave concept (VWC) is a prominent approach for performing thermographic reconstruction, which leverages ultrasonic methods for accurately inferring the internal structures of objects under evaluation. However, performing the VWC reconstruction process from surface temperature measurements is challenging, as it requires solving a series of ill-posed inverse problems. Although deep learning techniques have recently shown promising results in solving the underlying inverse problems, the evaluation and optimization of such approaches remains a critical challenge in IRT, as commonly used pixel-level metrics do not adequately represent practical reconstruction quality. To address this issue, we introduce an object-level evaluation framework aligned with the practical goal of industrial inspection: detecting individual structural faults rather than achieving pixel-perfect reconstruction. Our results on large-scale simulated datasets demonstrate the effectiveness of this approach in providing an accurate and detailed quantitative evaluation of DL-based reconstruction techniques. Additionally, the presented experiments highlight the alignment between qualitative evaluation and the proposed quantitative approach.
The structural integrity of aeroengine blades is paramount to flight safety, yet the inspection of these critical components remains a significant challenge due to their complex geometries and exposure to extreme operating environments. While Visual Inspection (VI) serves as the standard industrial baseline for identifying surface anomalies, it is inherently limited in detecting subsurface defects such as micro-cracks, delaminations, or fatigue that do not manifest externally. Infrared Thermography (IRT) offers a complementary solution by revealing subsurface thermal abnormalities. This study proposes an automated, bimodal deep learning framework to bridge this gap, specifically investigating the quantitative performance gains achieved by fusing RGB visual data with Active Infrared Thermography. The research focuses on a comparative analysis between unimodal (vision-only) and dual-modal (Vision + IRT) defect detection models applied to a dataset of paired, defective aeroengine blades. The proposed methodology utilizes a Convolutional Neural Network (CNN) architecture for the automated classification of defects. To validate the efficacy of this approach, the model is trained and tested on a standardized dataset of blades containing induced defects common to high-stress aerospace components, including surface cracks and impact damage. The dual-modal dataset is collected in a synchronized sense, where visual and thermal images are paired and matched together. This will allow for the direct comparison of inspection feasibility between the two Non-Destructive Testing (NDT) domains. The performance is benchmarked against a state-of-the-art unimodal ResNet-50 baseline operating solely on visual data. Preliminary results hope to show that the bimodal framework achieves a measurable improvement in classification accuracy and sensitivity. Specifically, the inclusion of quantitative thermographic data significantly reduces false negatives for subtle, near-surface defects that are visually ambiguous, demonstrating that thermal signatures provide critical discriminative features that visual data alone cannot capture. This work demonstrates that integrating infrared thermography with deep learning-based visual inspection creates a robust, synergistic diagnostic tool. By moving beyond unimodal reliance, the proposed bimodal framework offers a pathway toward more reliable, automated, and non-destructive evaluation workflows for the aerospace maintenance sector. The study highlights the indispensable role of thermal imaging not just as a standalone tool, but as a vital component of multi-sensor AI systems.
While not yet a common practice in standard medicine, infrared imaging is emerging as a promising non-invasive tool to support diagnostics, offering functional and physiological insights beyond the capabilities of conventional imaging techniques. By capturing subtle variations in surface and sub-surface thermal patterns, IR imaging provides real-time visualization of hemodynamic changes linked to disease states. The list of diseases that have the potential to be screened using thermal infrared imaging is surprisingly long and a continuous work is underway to test the validity and reliability of this new tool for medical use. The integration of small, radiometrically calibrated infrared cameras further enhances clinical utility by enabling accurate, quantitative temperature assessments in diverse healthcare settings.
The work presented here is a preliminary study that was conducted at Pamukkale University Hospital, within the group of Professor Ahmet Koluman. Thermogram images were acquired using the Radia V60, a new uncooled radiometrically calibrated longwave IR camera from Telops, to investigate its screening utilization potential across various disease groups. The study encompassed individuals diagnosed with breast cancer, peripheral artery disease (PAD), juvenile idiopathic arthritis (JIA), thyroid diseases, and the groups were evaluated alongside healthy control groups. For breast cancer, differences in tumor-induced metabolic activity were identified via heat distribution patterns within the thermography images acquired by the infrared thermal camera. It has shown promise as a painless, radiation-free, non-invasive, and rapid preliminary screening method. For PAD patients, acquisitions demonstrated that blood flow impairments in the leg vasculature, resulting from stenosis (narrowing) or occlusion (blockage), manifested as regions of excessive cold (hypothermia) or heat (hyperthermia). JIA patients, a condition predominantly observed in children, showed thermal alterations surrounding the knee joint which were successfully observed in the infrared images. Regions of inflammation within the knee joint were distinctly identified. As for Thyroid disease screening, Within the scope of this study, the acquisitions of the cervical (neck) region demonstrated that the method possesses diagnostic potential, however, owing to this region's susceptibility to environmental influences, the risk of false positivity was found to be elevated. Within this study, a total of 139 individuals were screened using an infrared thermal camera. This study reinforces the potential of IR imaging as a safe preliminary screening tool, especially due to its key characteristic of being: non-invasive, radiation-free, painless, and fast.
The evaluation of vascular access in patients with chronic kidney disease undergoing hemodialysis requires accurate and reliable diagnostic techniques capable of delineating superficial venous anatomy, hemodynamic alterations, and the anatomical characteristics of arteriovenous fistulas (AVFs), while minimizing invasiveness and patient-related risks. In this context, clinical infrared thermography imaging represents a non-invasive functional technique based on the quantitative analysis of cutaneous temperature variations closely related to local blood perfusion.
Thermography detects infrared radiation emitted by tissues at temperatures above absolute zero using high-resolution professional thermal cameras (464 × 348 pixels in the present study, FLIR A500). To obtain clinically meaningful measurements, thermographic assessments were performed after a 30-minute acclimatization period in a temperature-controlled environment (approximately 25°C), allowing stabilization of baseline skin temperature. Under these conditions, thermal maps of the arms and forearms enable the identification of hyperthermic areas associated with mature AVFs and high blood flow rates (>600 ml/min), as well as hypothermic regions suggestive of reduced perfusion or distal ischemia. In this study, thermography was applied both in the preoperative phase and during postoperative follow-up of AVFs.
In the preoperative setting, thermography was integrated with intravenous infusion of cooled saline solution (15°C), administered at 20 ml/min via a needle cannula placed distally to the planned anastomotic site. The aim was to generate a controlled thermal gradient along superficial veins, detectable within approximately 30 seconds after infusion, thereby enhancing visualization of venous pathways and enabling identification of flow discontinuities, stenoses, or collateral circulation, without inducing vascular trauma or phlebitic complications.
Thermography was also employed in the assessment of arterial perfusion through post-occlusive reactive hyperemia (PORH) testing, with results compared to those obtained by pulsed-wave Doppler ultrasound. Based on Doppler-derived resistance indices, 7 subjects were classified as having a normal vascular response and 7 as vasculopathic. The same subjects subsequently underwent thermographic monitoring during the reperfusion phase. In healthy subjects, the reperfusion phase was characterized by a significant increase in skin temperature (ΔT = 3.22 ± 1.18°C), whereas in vasculopathic patients the thermal response was markedly reduced (ΔT = 1.43 ± 0.89°C), in agreement with Doppler findings.
In relation to digital phlebography, currently considered the gold standard for the evaluation of deep and central veins, cold-contrast thermography demonstrates high sensitivity in the early diagnosis of hemodialysis access–induced distal ischemia (HAIDI) and in the identification of superficial venous drainage abnormalities.
In conclusion, clinical thermography represents a complementary diagnostic tool to conventional imaging techniques, providing a functional, dynamic, and repeatable assessment of vascular access. Further prospective studies could contribute to standardizing acquisition and analysis protocols, quantitatively assessing diagnostic accuracy, and defining guidelines for the routine integration of thermography into clinical pathways for vascular access management.
Introduction. The increasing demands of human space missions require non-invasive and autonomous health-monitoring technologies suitable for extreme environments. Quantitative infrared thermography (QIRT) is a promising tool for space medicine, providing contactless, real-time assessment of skin temperature and physiologically relevant information related to microcirculation, inflammation, body fluid shifts, metabolic activity and thermoregulation.
Methods. This scoping review and perspective explores the current and future role of QIRT in space medicine, with a focus on simulated microgravity and long-duration missions. Following PRISMA guidelines, 2,461 records were identified from PubMed, Scopus and Google Scholar; 63 studies were screened in full and, based on predefined eligibility criteria, only five human studies employing QIRT in real or simulated space environments were included.
Results. All included studies used infrared thermography to assess skin temperature as an indirect indicator of fluid shifts, with or without complementary sensors (e.g., thermistors and core temperature pills). One study demonstrated the feasibility of IRT during parabolic flights1, showing gravity-dependent changes in peripheral skin temperature. Other studies conducted during bed rest and head-down tilt reported altered regional skin temperature distributions consistent with blood and fluid redistribution under simulated microgravity, supporting IRT as a potential tool to investigate spaceflight-related fluid shift phenomena2-5.
Authors’ comment. Building on this limited body of evidence, the application of infrared thermography (IRT) in space medicine may require additional implementation guidelines. For instance, in bed-rest analogues, prolonged mattress contact and continuous skin pressure may affect thermogram accuracy. In such conditions, placing a blackbody reference beneath the region of interest could improve calibration; however, this must be balanced against the potential burden and stress of repeated measurements on participants. Existing IRT guidelines should therefore be adapted to the specific constraints of bed-rest study designs.
Recent unpublished findings further support the use of IRT in spaceflight analogues to monitor fluid redistribution and, when exercise countermeasures are implemented, to assess muscle temperature and fluid dynamics. Consistent with applications in sport science, IRT may also enable early detection of musculoskeletal injury risk, as localized temperature elevations often precede clinical symptoms and the need for more complex imaging such as MRI or X-ray. This capability is particularly valuable in spaceflight, where rapid, non-invasive tools for injury surveillance are critical for astronaut health.
Conclusion. Future space-analogue investigations should consider incorporating infrared thermography (IRT) as part of baseline physiological monitoring, while further validating its reliability and operational feasibility. In parallel, space agencies may explore the potential integration of IRT aboard the International Space Station as a complementary, non-invasive screening tool for astronaut health, pending additional evidence and standardization of measurement protocols.
Acknowledgements. This work was supported by the Slovene Research and Innovation Agency programme grant no. P2-0076.
Reducing skin-friction drag in turbulent flows remains a central challenge in fluid mechanics due to its direct impact on energy consumption in aerodynamic and hydrodynamic applications. Drag reduction strategies are commonly divided into active and passive techniques. Active methods require an external energy input and include flow control approaches such as fluid injection, suction, and wall oscillations. Passive techniques, by contrast, rely on surface geometry modifications and are therefore attractive for practical applications due to their simplicity and robustness. Among passive drag reduction methods, riblets have received considerable attention. Inspired by the micro-scale structures found on shark skin, these grooved surfaces have been shown to reduce skin-friction drag by altering near-wall turbulent structures [1]. Both experimental and numerical studies have demonstrated that suitably designed riblet geometries can achieve drag reductions of up to approximately 10% under optimal flow conditions [2]. While early studies primarily focused on straight, streamwise-aligned riblets, more recent research has explored complex geometrical variations aimed at further enhancing performance. The riblet geometry considered in the present work consists of scalloped riblets featuring a sinusoidal modulation in the streamwise direction [3]. This configuration represents a departure from conventional straight riblets and is designed to introduce a controlled spatial variation that may further alter the interaction between the surface and near-wall turbulence. Skin-friction measurements can be obtained using either direct or indirect experimental techniques. Direct approaches, such as force balances and skin-friction balances, provide straightforward measurements but may introduce mechanical complexity or interfere with the flow. Indirect techniques estimate skin friction based on related flow quantities and theoretical relationships. Common indirect methods include the two-dimensional boundary-layer momentum integral approach, velocity measurements obtained through hot-wire anemometry or Particle Image Velocimetry. Since their quasi-non-intrusive nature, indirect methods are usually preferred over the direct ones. In this context, the present study explores an alternative indirect methodology based on Infrared Thermography coupled with thin film heat flux sensors [4]. The approach exploits the Reynolds analogy, to relate variations in convective heat transfer h to changes in skin-friction coefficient. By comparing measured h over riblet surfaces with that obtained over a smooth flat plate under identical flow conditions, an indirect estimate of drag reduction can be obtained. The results show a significant reduction in convective heat transfer, which can be directly associated with a corresponding reduction in skin friction. These findings support the potential of Infrared Thermography as a valuable tool for the aerodynamic characterization of riblet-based drag reduction concepts.
References
1. Choi K.S. Near-wall structure of a turbulent boundary layer with riblets. Journal of Fluid Mechanics, 208:417– 458, 1989.
2. García-Mayoral R. and Jiménez J. Drag reduction by riblets. Philosophical Transactions of the Royal Society A: Mathematical, Physical and Engineering Sciences, 369(1940):1412–1427, 2011.
3. Cafiero G. and Iuso G. Drag reduction in a turbulent boundary layer with sinusoidal riblets. Experimental Thermal and Fluid Science, 139:110723, 2022.
4. Astarita T. and Carlomagno G.M. Infrared Thermography for Thermo-Fluid-Dynamics. Springer, 2013.
Atherosclerotic disease of the carotid artery is a chronic pathological condition characterized by the progressive accumulation of lipid-rich plaques within the arterial wall, resulting in structural remodeling, altered hemodynamic conditions, and luminal narrowing, thereby posing a high risk of ischemic stroke. In this context, early identification of carotid stenosis is crucial to enable timely intervention and reduce the likelihood of ischemic events. To this end, several imaging modalities are currently used to screen the carotid artery, including computed tomography angiography (CTA), magnetic resonance angiography (MRA), and catheter-based angiography (CBA). However, except for carotid ultrasound (CU), these techniques are either invasive or require ionizing radiation or contrast agents. From this perspective, the present work presents an in-silico framework designed to explore the potential of infrared thermography (IRT) based approaches for detecting carotid stenosis from skin thermal footprints of the vessel. The underlying rationale is that atherosclerotic plaque-induced alterations in vascular geometry and blood fluid dynamics modify local heat transport mechanisms, thereby producing surface temperature variations in the surface temperature distribution. A synthetic thermographic dataset was generated using 3D multiphysics simulations (through GPU-accelerated finite difference method with immersed boundary methods), in which pulsatile blood flow and heat transfer were solved in a coupled manner. Precisely, the model resolved fluid dynamics within the vessel, conductive heat transport in the vessel and in the surrounding tissue, and convective heat exchange at the skin-air interface. The simulation framework implemented a structured parametrization of three boundary physical parameters. Blood inflow rate (Qin), convective heat transfer coefficient (h), and ambient air temperature (Tair) were varied according to a one-factor-at-a-time protocol, while all other parameters were held constant. This approach produced 36 virtual subjects, each one simulated until a periodic regime is attained. Then the unsteady dynamics within 5 seconds, corresponding to 50 consecutive frames, capturing the cardiac cycles driven thermal response, are saved. For each subject, three physiopathological configurations were simulated, corresponding to 0% (healthy), 30%, and 70% carotid stenosis, resulting in a set of 1800 in-silico thermographic images representing vessel-induced thermal footprints on the skin surface. Furthermore, the simulations indicated that stenosis-related surface temperature changes range in the order of hundredths of a degree Celsius, which fall within the measurable sensitivity actual IRT systems. Additionally, a VGG16 model was finetuned on the in-silico thermographic dataset within a group k-fold cross-validation framework to distinguish between the three stenotic scenarios, reaching a test accuracy of 95%. These findings suggest that IRT, combined with deep learning (DL) algorithms, may effectively capture subtle hemodynamic and thermal changes caused by atherosclerotic plaques, supporting its feasibility as a non-invasive tool for early carotid artery assessment.
High-lift capability remains a key requirement for aircraft during take-off and landing, traditionally achieved through passive high-lift devices such as slats and flaps that, over the years, have undergone continuous refinement, leading to increasingly efficient but also mechanically complex systems [1]. Active flow-control concepts, such as circulation control (CC), offer a lighter and mechanically simpler alternative. This work presents an Infrared Thermography (IRT)-based experimental investigation of boundary-layer transition and separation on a high-lift airfoil whose shape and active flow control were contemporarily optimized, particularly a tangential jet is issued near the trailing edge, on the airfoil upper surface, to enhance circulation, sustain attachment, and delay separation. The tests were carried out in two configurations: Jet-On and Jet-Off. To evaluate the effect of tripping adding disturbances, a boundary-layer trip was applied at 10% of the chord and extended over 10% of the chord length. Two regions are of interest, one affected by a natural transition and the other by a forced one. The IRT tests were conducted in parallel with Wall-Pressure Measurements (WPM) and Particle Image Velocimetry (PIV) campaigns.
IRT provides non-intrusive, full-field visualization of boundary-layer state by exploiting the different convective heat-transfer behavior of laminar and turbulent flows [2,3]. Treating the test model as a thin-film sensor, the convective heat-transfer coefficient h (or equivalently the Stanton number St) is reconstructed and, through Reynolds analogy [4], it gives information about boundary-layer transition and separation.
Results show a strong link between boundary layer behavior, thermal response and blowing. Normalized temperature trends reveal that the temperature rise is generally lower in the Jet-On case. This is caused by the higher velocities that occur in this case since the flow remains attached, promoting higher shear stress $\tau_w$ on the wall and therefore higher h and lower temperature. In fact, the chordwise St distribution highlights that, with Jet-On, transition is shifted downstream, and flow separation is delayed by keeping the flow attached and a laminar boundary layer over most of the chord. Conversely, Jet-Off exhibits earlier transition and a separated region near the trailing edge. Overall, this study demonstrates IRT as a robust and scalable technique to investigate the effects of circulation control on transition and separation in high-lift airfoils.
$\textbf{References}$:
1. KC Peter, High-lift systems on commercial subsonic airliners, NASA CR-4746, Sept, 1996.
2. Giovanni Maria Carlomagno and Gennaro Cardone, Infrared thermography for convective heat transfer measurements, Experiments in fluids, 49(6):1187–1218, 2010.
3. William Davis and Nicholas R Atkins, Infrared thermography techniques for boundary layer state visualisation, Experiments in Fluids, 65(6):91, 2024.
4. Arthur D. Woodworth, David M. Salazar, and Tianshu Liu, Heat transfer and skin friction: beyond the Reynolds analog, International Journal of Heat and Mass Transfer 206 (2023), p. 123960.
